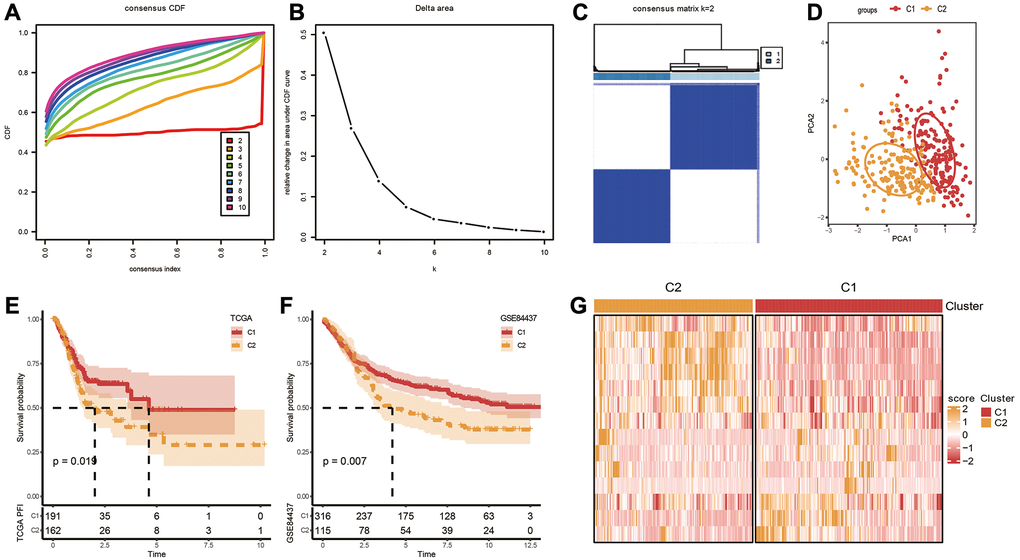
Figure 2.Identification of molecular subtypes. (A) Cumulative distribution function. (B) Delta area. (C, D) Heatmap and PCA plots of sample clustering when k = 2 in TCGA-STAD. (E, F) K-M survival analysis of C1 and C2 in TCGA-STAD and GSE84437 datasets. (G) Expression levels of 14 genes in C1 and C2 subtypes based on TCGA-STAD dataset.