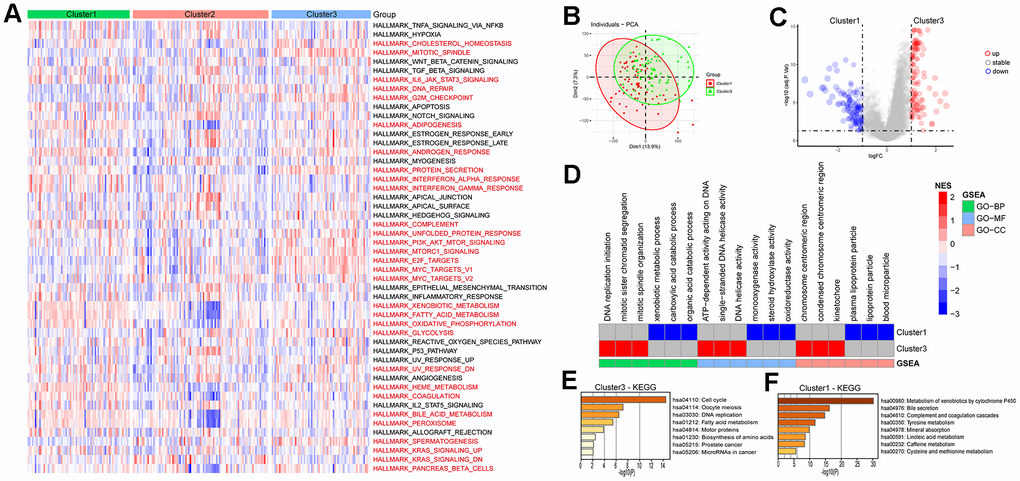
Figure 6.Enrichment analysis of HCC subtypes. (A) Analysis of Hallmark gene set score differences in the HCC subtypes. (B, C) Differential genetic analysis of HCC in cluster1 and cluster3. (D) Enrichment analysis of differential genes in HCC cluster1 and cluster3. (E, F) KEGG enrichment analysis of differential genes in HCC cluster1 and cluster3.