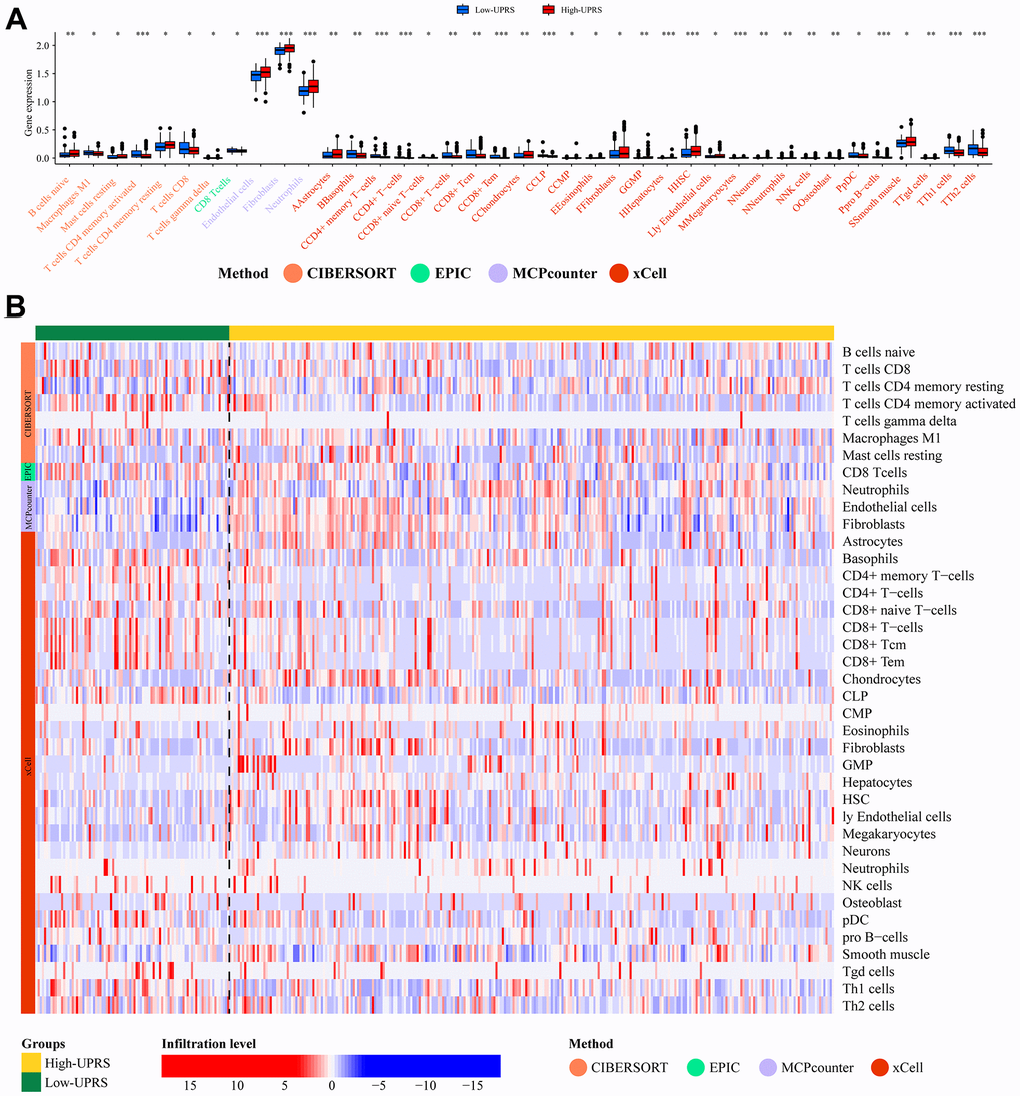
Figure 9.Analysis of immune cell infiltration. (A) The barplot and (B) heatmap showed the difference in immune cell infiltration between patients with high- and low-UPRS.
Figure 9 — Unraveling the unfolded protein response signature: implications for tumor immune microenvironment heterogeneity and clinical prognosis in stomach cancer | Aging