Submit an Article
Navigate
Home
Editorial Board
Editorial Policies
Current Volume
Archive
Scientific Integrity
Publication Ethics Statements
Interviews with Outstanding Authors
Newsroom
Sponsored Conferences
Podcast
Contact
Special Collections
Submit an Article
Online ISSN: 1945-4589
Research Paper
|
Volume 16, Issue 9
|
pp. 7774–7798
The identification of a N
6
-methyladenosin-modifed immune pattern to predict immunotherapy response and survival in urothelial carcinoma
Back to article
Figure 4
(4 of 9)
−
100%
+
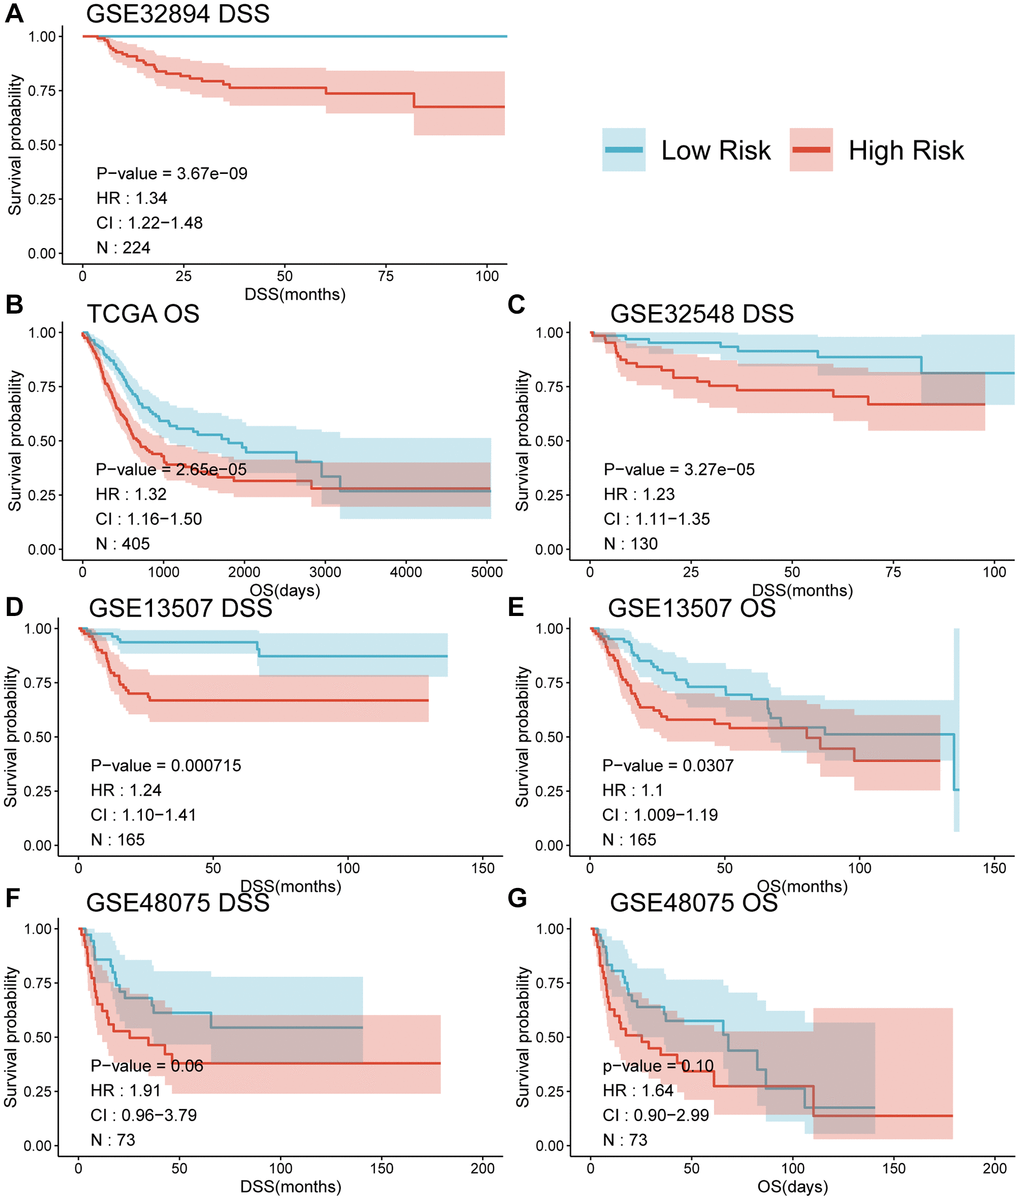
Figure 4.
Survival curves (
A
–
G
) comparing the survival between different risk groups based on MPIGs across various datasets.