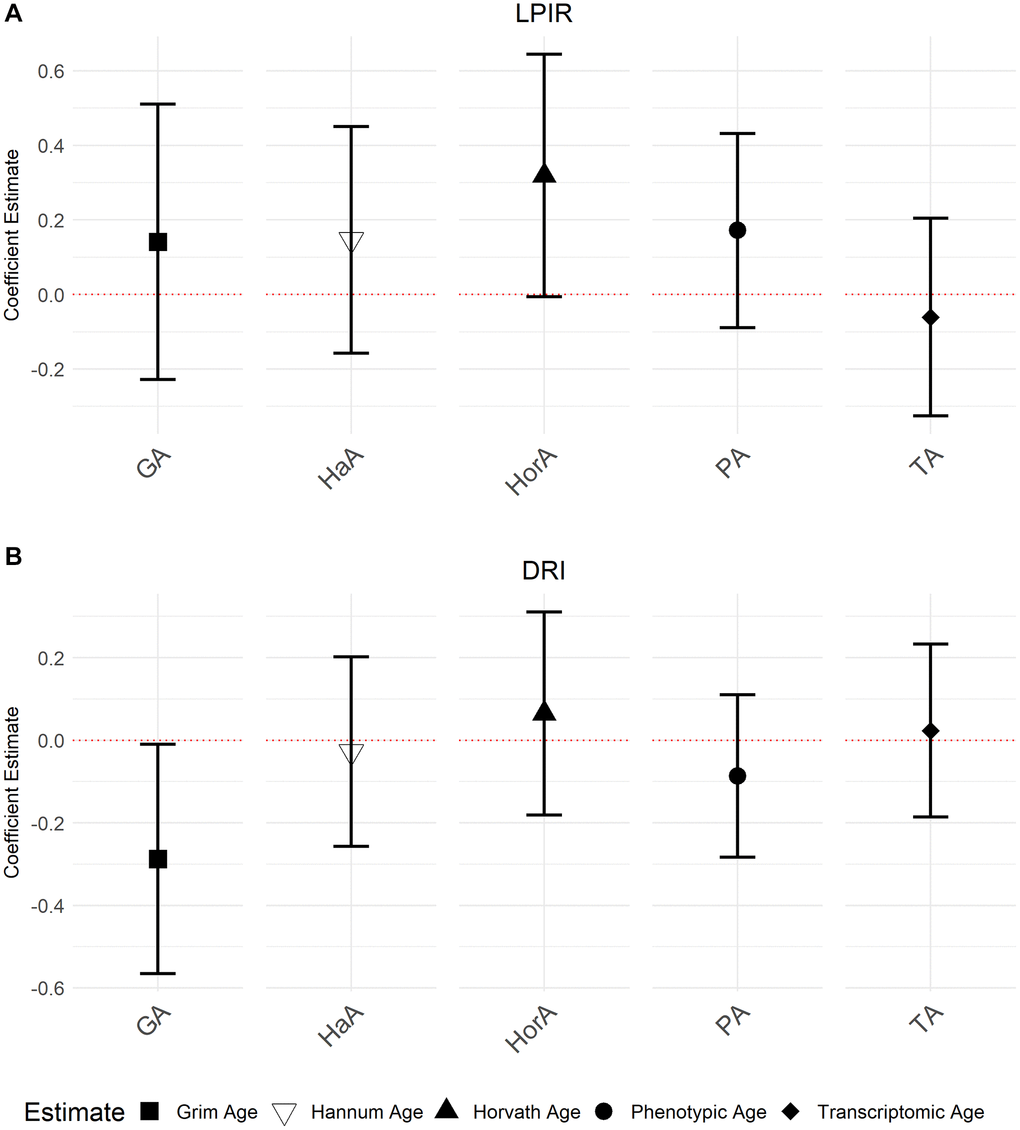
Figure 5.Associations between NMR biomarkers LP-IR and DRI and the accelerated ages of epigenetic and transcriptomic biomarkers. Models were run with accelerated ages of epigenetic and transcriptomic biomarkers (Abbreviations: GA: GrimAge; HaA: Hannum Age; HorA: Horvath Age; PA: Phenotypic Age; TA: Transcriptomic Age). (A) is the association between LP-IR and the aging predictors and (B) displays the association between DRI and the aging predictors. Error bars represent 95% confidence intervals.