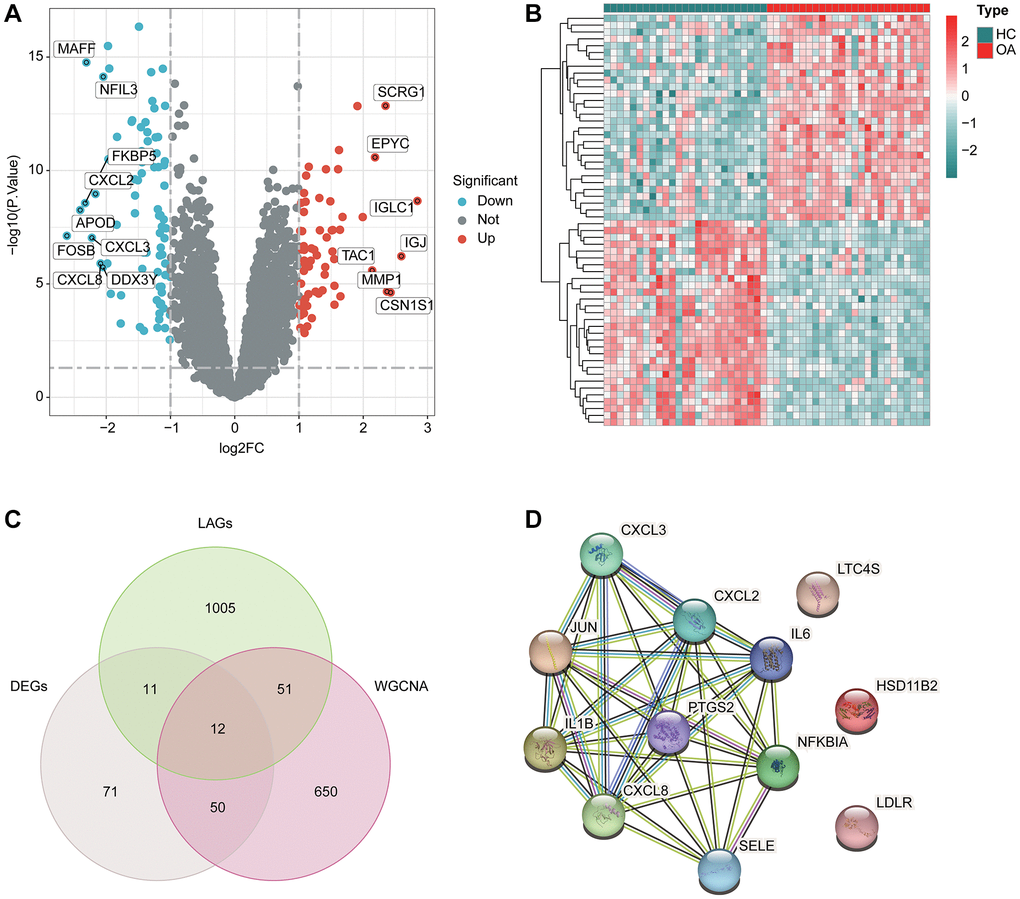
Figure 2.DE-LAGs screening. (A) Volcano plot of DEGs in HC and OA groups. The threshold of screening DEGs is set at |fold change| ≥ 2 and p.adjust < 0.05. Turquoise dots represent down-regulated genes and red dots represents up-regulated genes. (B) Analysis of top 25 up- and down-regulated genes in HC and OA group. (C) Identification of pivotal DE-LAGs in brown module. (D) Protein-protein interaction (PPI) network analysis among screened genes.