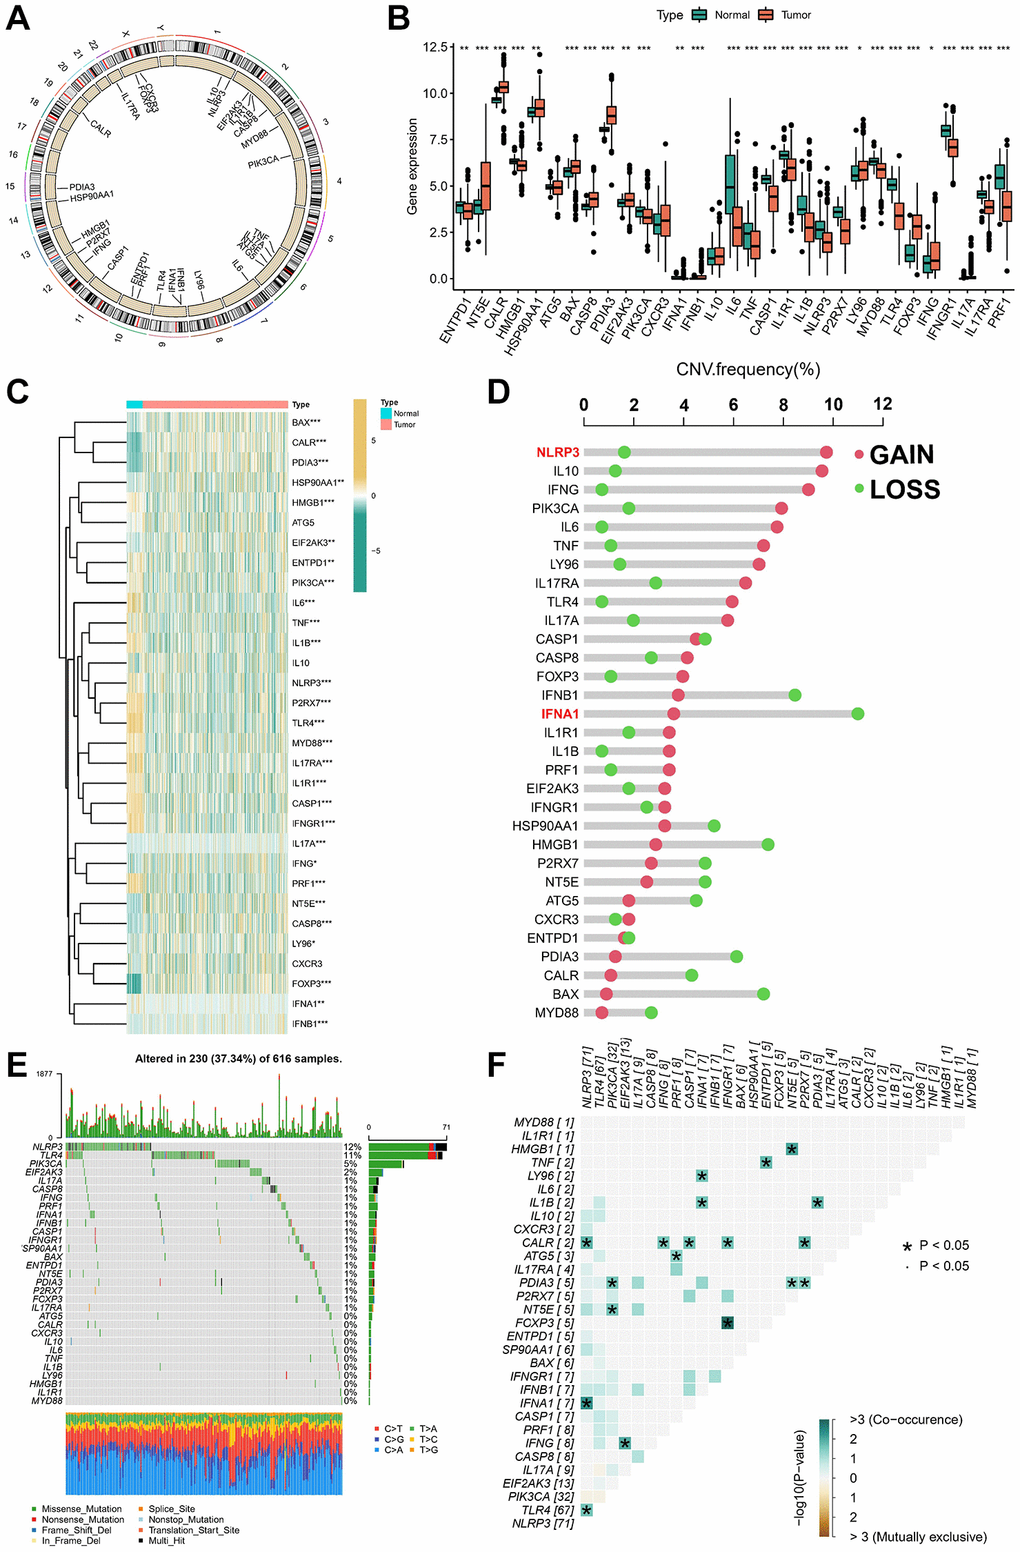
Figure 1.Landscape of 31 ICDGs in LUAD. (A) Circus plots of chromosome distributions of ICDGs. (B) Expression distributions of ICDGs between LUAD and normal tissues. (C) Heatmap shows 31 ICDGs expression profiles among normal and LUAD samples. (D) The CNV mutation frequency of ICDGs. (E) Somatic mutation spectrums of ICDGs. (F) Correlation between 31 ICDGs in TCGA-LUAD. *p < 0.05, **p < 0.01, ***p < 0.001.