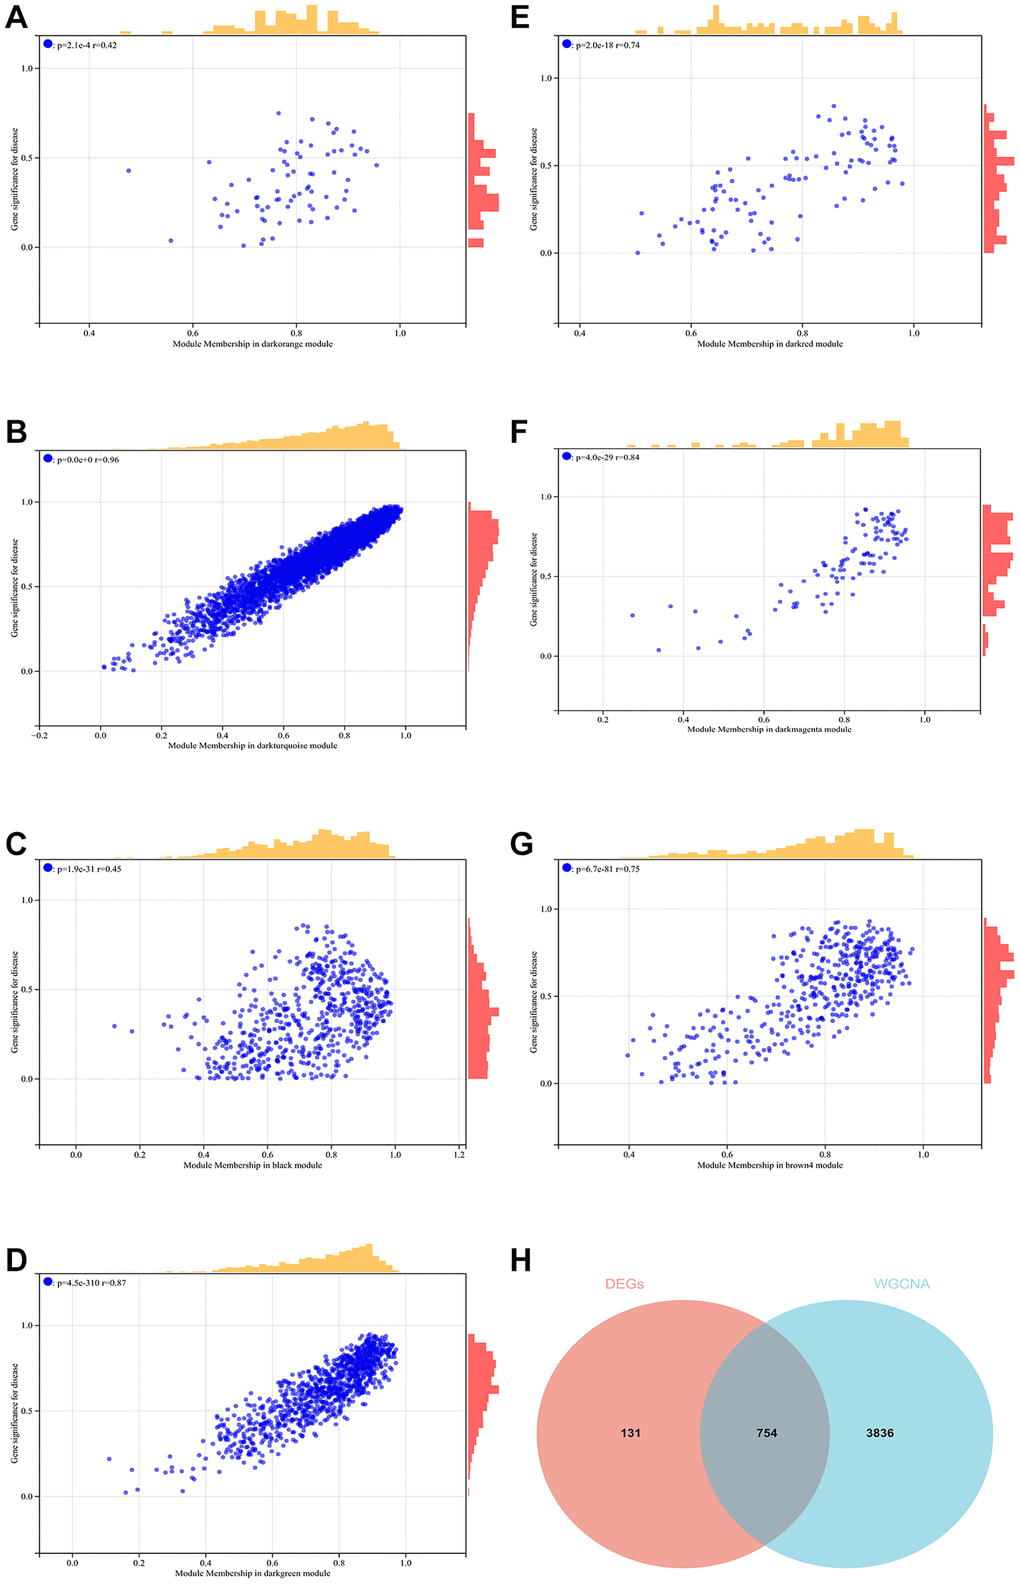
Figure 7.WGCNA. (A–G) GS-MM correlation scatter map of related hub genes. (H) The Venn diagram of the differential genes screened by WGCNA and DEGs and take the intersection to create and analyze the protein-protein interaction network.
Figure 7 — CCNA2 and KIF23 are molecular targets for the prognosis of adenoid cystic carcinoma | Aging