Submit an Article
Navigate
Home
Editorial Board
Editorial Policies
Current Volume
Archive
Scientific Integrity
Publication Ethics Statements
Interviews with Outstanding Authors
Newsroom
Sponsored Conferences
Podcast
Contact
Special Collections
Submit an Article
Online ISSN: 1945-4589
Research Paper
|
Volume 16
CCNA2 and KIF23 are molecular targets for the prognosis of adenoid cystic carcinoma
Back to article
Figure 10
(10 of 13)
−
100%
+
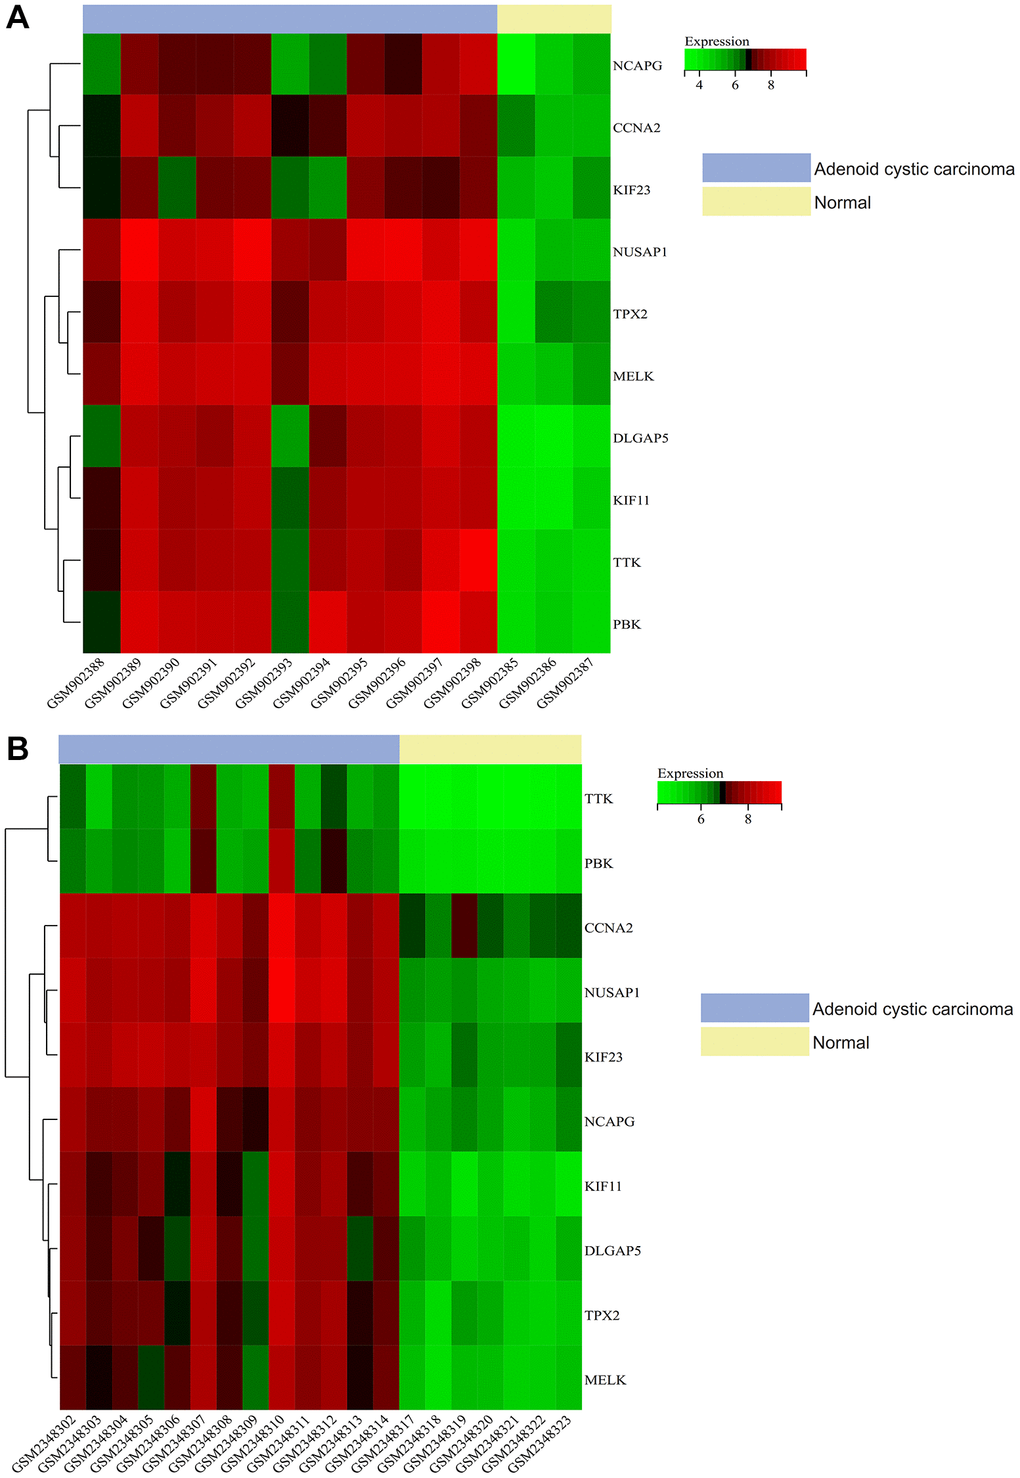
Figure 10.
Gene expression heat map.
The heat map of the expression of core genes in the samples. (
A
) The result of GSE36820. (
B
) The result of GSE88804.