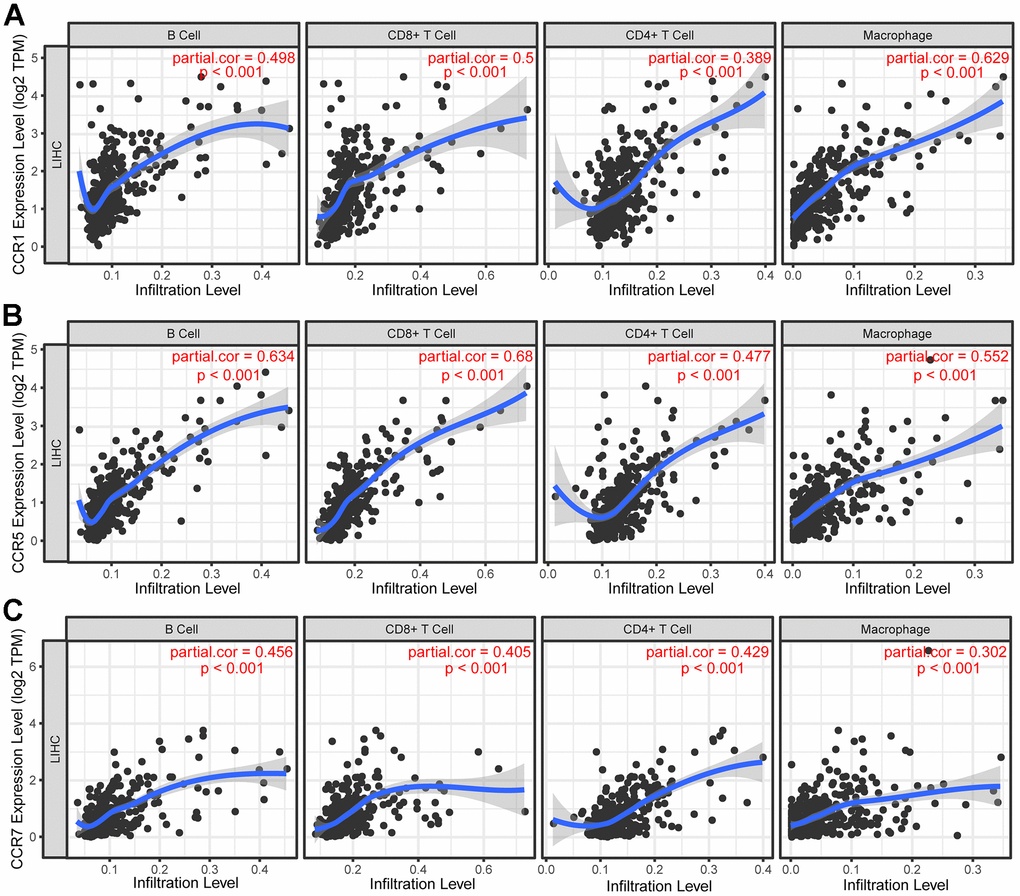
Figure 9.Correlation between CCRs expression and tumor-infiltrating immune cells. (A) Scatter plot in terms of CCR1 expression and tumor-infiltrating immune cells; (B) scatter plot in terms of CCR5 expression and tumor-infiltrating immune cells; (C) scatter plot in terms of CCR7 expression and tumor-infiltrating immune cells.