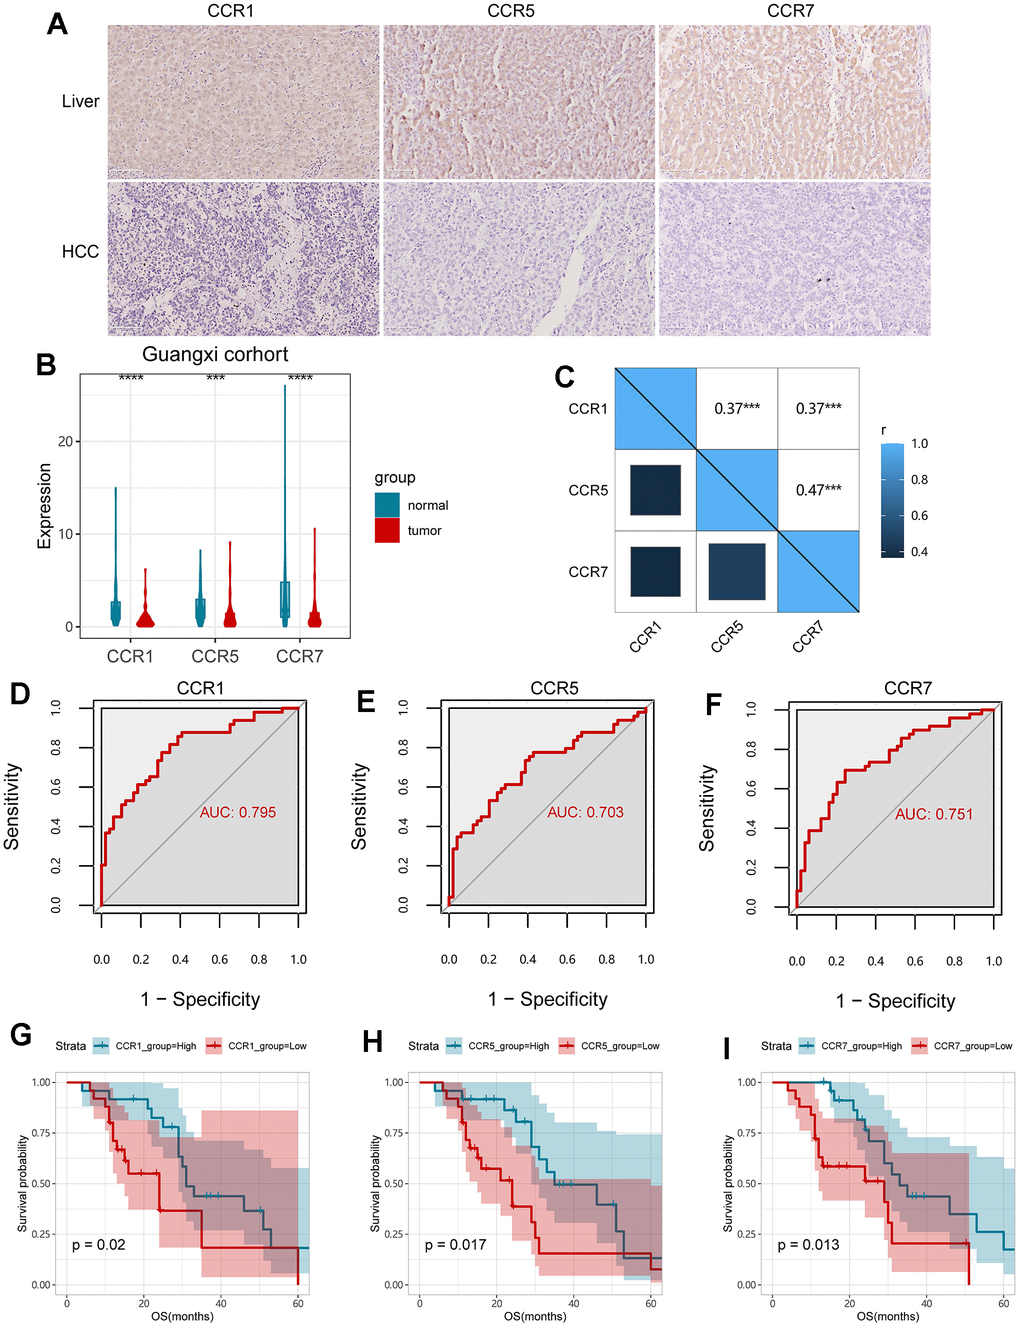
Figure 6.Validation of CCR1, CCR5 and CCR7 in Guangxi cohort. (A) Expression of CCR1, CCR5 and CCR7 in HCC and para-carcinoma live tissues detected with IHC assay; (B) expression of CCR1, CCR5 and CCR7 in HCC and para-carcinoma live tissues detected with qPCR assay; (C) Matrix graphs of Pearson correlations for CCR1, CCR5 and CCR7; (D–F) ROC curves for CCR1, CCR5 and CCR7; (G–I) survival analysis for OS in terms of CCR1, CCR5 and CCR7; ** P<0.01; *** P<0.001.