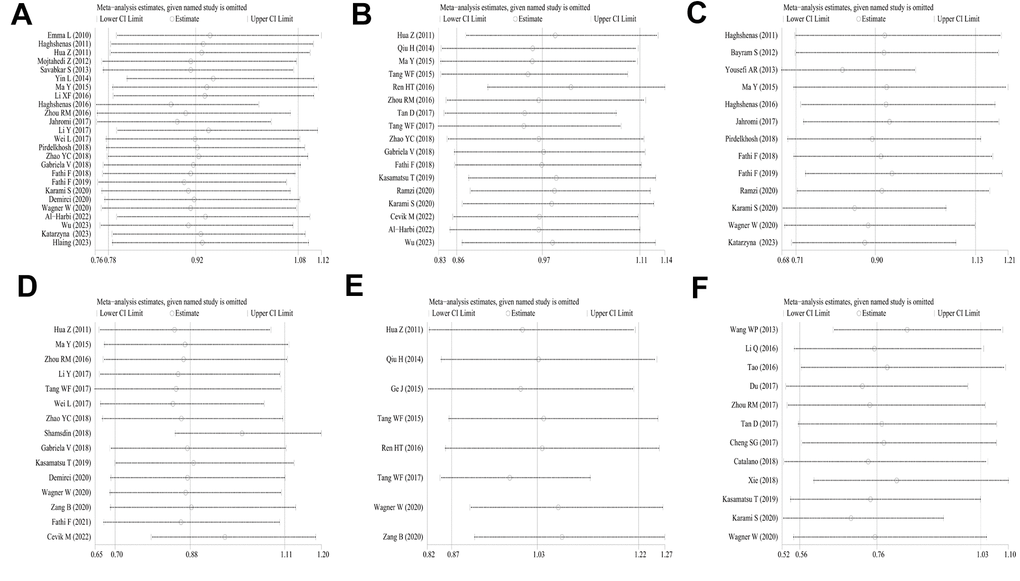
Figure 9.Analyses of the influence of a single study on the total combined OR in the dominant model. (A) PD-1.5 polymorphism; (B) PD-1.9 polymorphism; (C) PD-1.3 polymorphism; (D) PD-1.1 polymorphism; (E) PD-1 rs7421861 polymorphism; (F) PD-L1 rs4143815 polymorphism.