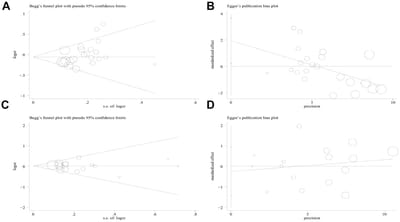
Figure 10.Begg’s funnel plot and Egger’s linear regression test for the publication biases under the dominant model. (A) Begg’s test for PD-1.5 polymorphism; (B) Egger’s test for PD-1.5 polymorphism; (C) Begg’s test for PD-1.9 polymorphism; (D) Egger’s test for PD-1.9 polymorphism.
(E) Begg’s test for PD-1.3 polymorphism; (F) Egger’s test for PD-1.3 polymorphism; (G) Begg’s test for PD-1.1 polymorphism; (H) Egger’s test for PD-1.1 polymorphism; (I) Begg’s test for PD-1 rs7421861 polymorphism; (J) Egger’s test for PD-1 rs7421861 polymorphism; (K) Begg’s test for PD-L1 rs4143815 polymorphism; (L) Egger’s test for PD-L1 rs4143815 polymorphism.