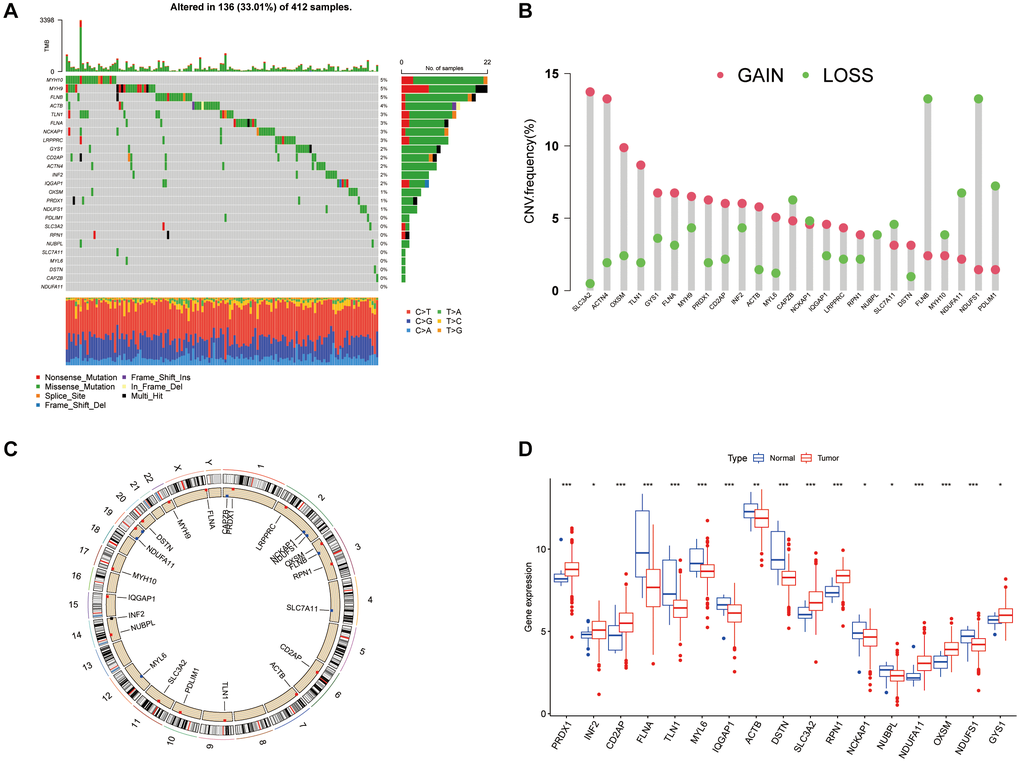
Figure 1.Genetic and expression variation landscape of DRGs in BLCA. (A) Mutation frequency of DRGs in 412 BLCA patients from the TCGA cohort. (B) CNV frequency of DRGs. (C) CNV positions of DRGs on chromosomes. (D) Expression of 26 DRGs in normal and BLCA tissue. *P < 0.05, **P < 0.01, ***P < 0.001.