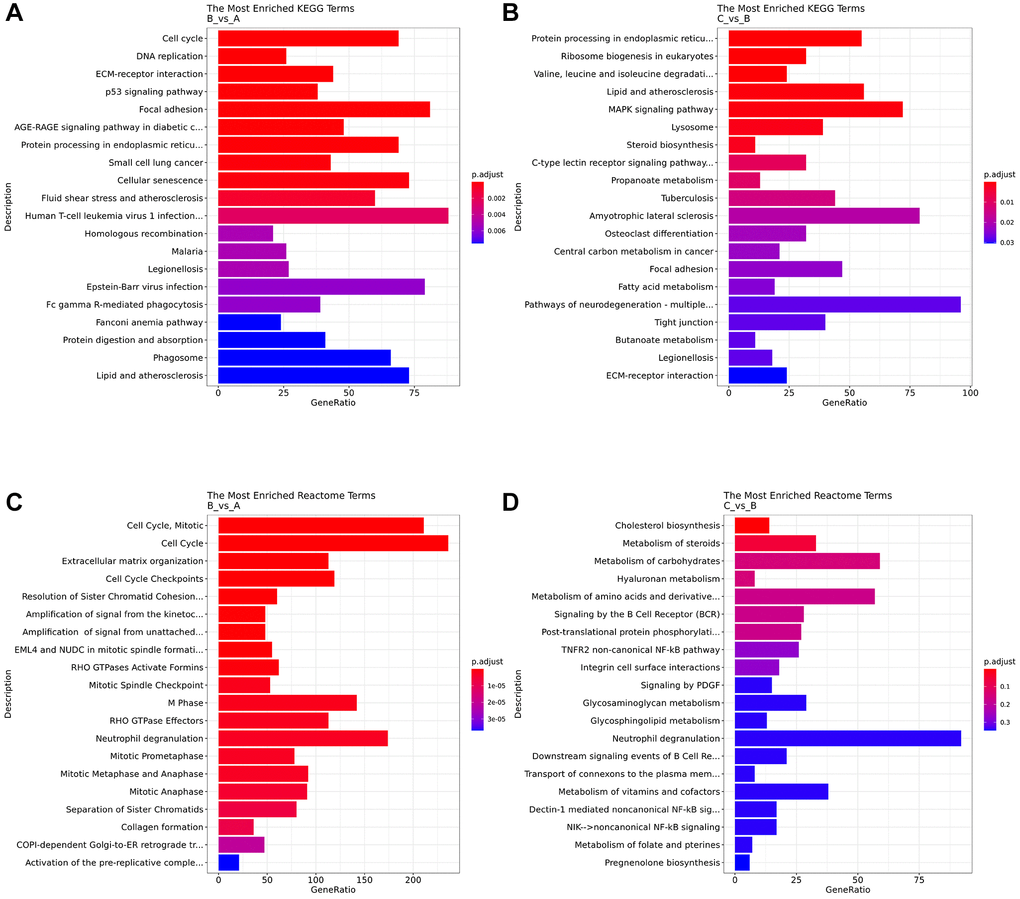
Figure 5.Analysis of pathway enrichment. (A) KEGG analyzed the top 20 enriched pathway between B and A group. (B) KEGG analyzed the top 20 enriched pathway between B and C group. (C) Reactome analyzed the top 20 enriched pathway between B and A group. (D) Reactome analyzed the top 20 enriched pathway between B and C group.