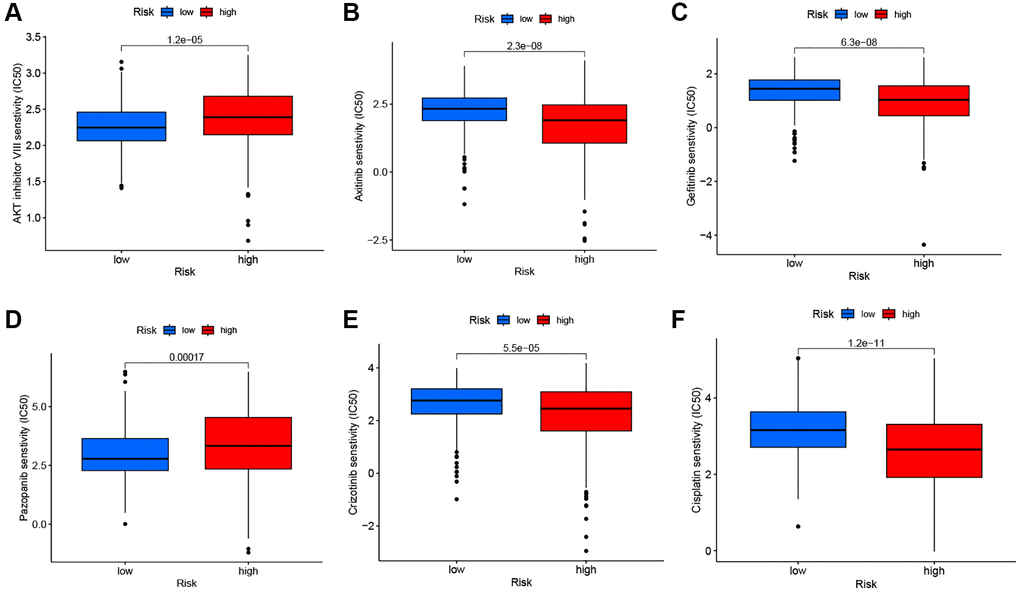
Figure 10.Drug sensitivity analysis. The comparisons in IC50 of AKT inhibitor (A), Axitinib (B), Gefitinib (C), Pazopanib (D), Crizotinib (E), and Cisplatin (F) between the two risk groups.
Figure 10 — Identification and validation of a novel signature based on macrophage marker genes for predicting prognosis and drug response in kidney renal clear cell carcinoma by integrated analysis of single cell and bulk RNA sequencing | Aging