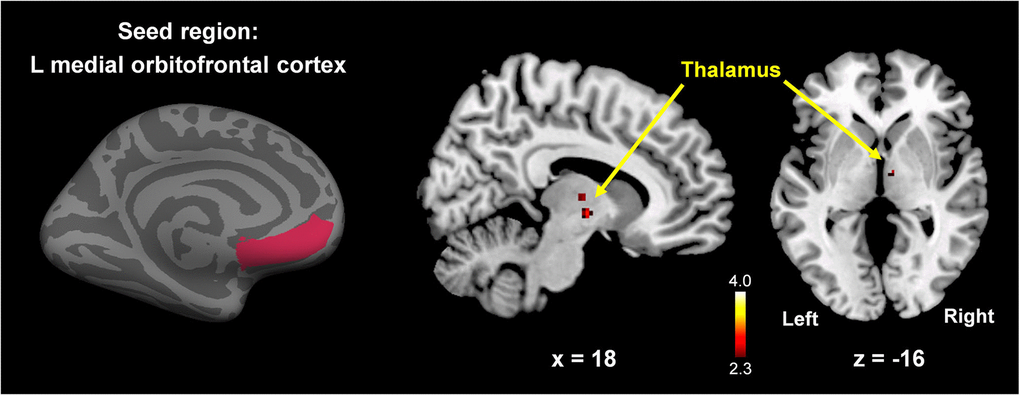
Figure 6.Between-group comparison map (premenopausal women vs. postmenopausal women) of the left mOFC functional connectivity. Postmenopausal women showed significantly lower functional connectivity between the left mOFC and right thalamus compared to premenopausal women (p < 0.005, Monte-Carlo corrected). The color-coded pixels were scaled to the range (t-value) more than the cut-off threshold (p < 0.005).