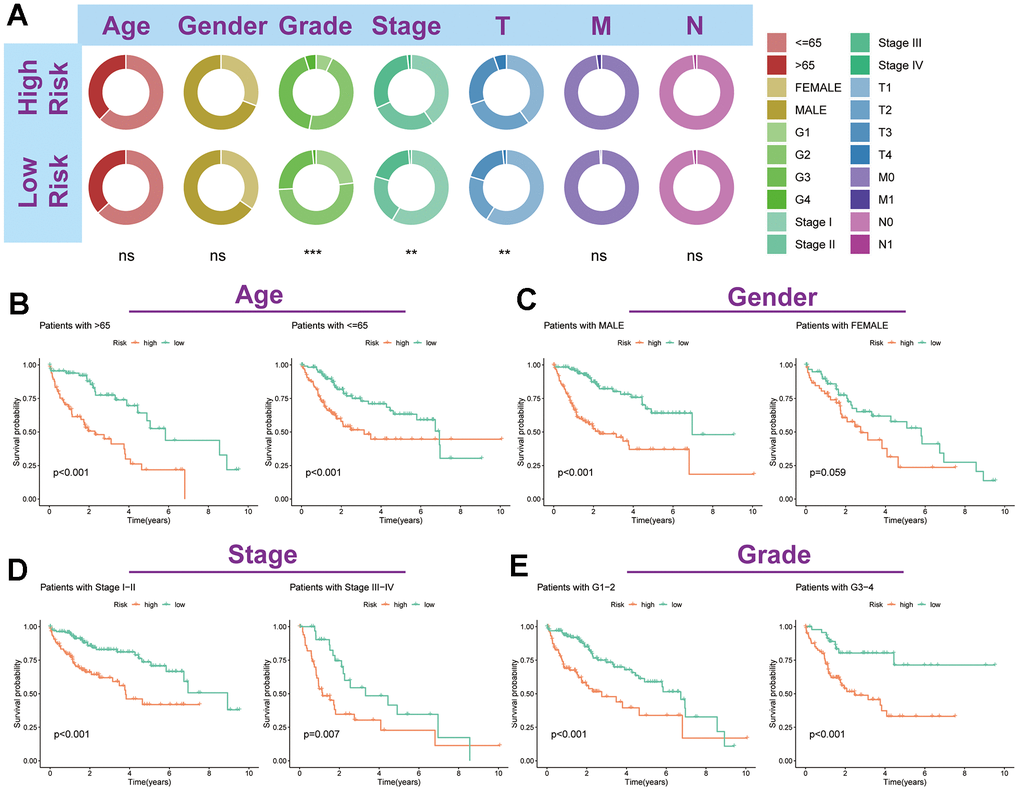
Figure 8.Association of TRSSys with clinical parameters in HCC. (A) Distribution status of different clinicopathologic parameters in two risk subgroups. (B–E) Kaplan-Meier curves revealed the survival between individuals in the two risk groups for age (B), gender (C), stage (D) and grade (E) subgroups.