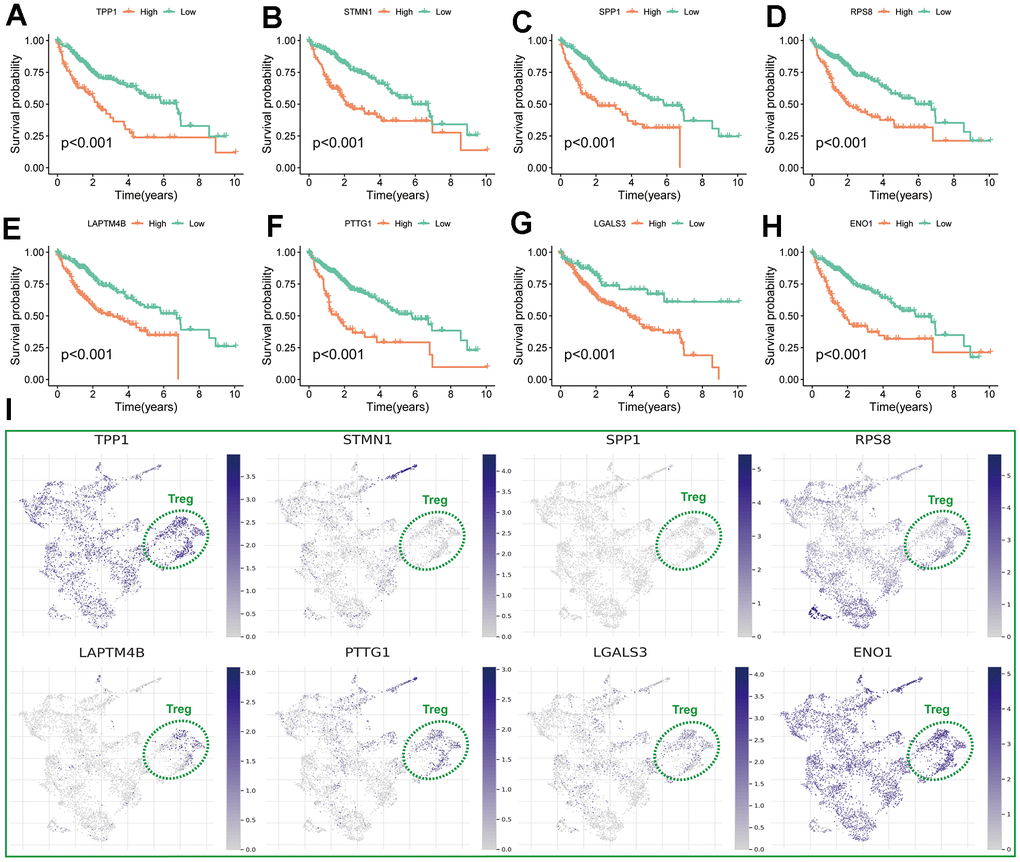
Figure 5.Assessment of TRSSys-related genes in HCC. (A–H) K-M curves of the 8 TRSSys-related for OS in the TCGA cohort. (I) The expression of TRSSys-associated TRGs in Tregs of GSE98638 cohort.
Figure 5 — Comprehensive assessment of regulatory T-cells-related scoring system for predicting the prognosis, immune microenvironment and therapeutic response in hepatocellular carcinoma | Aging