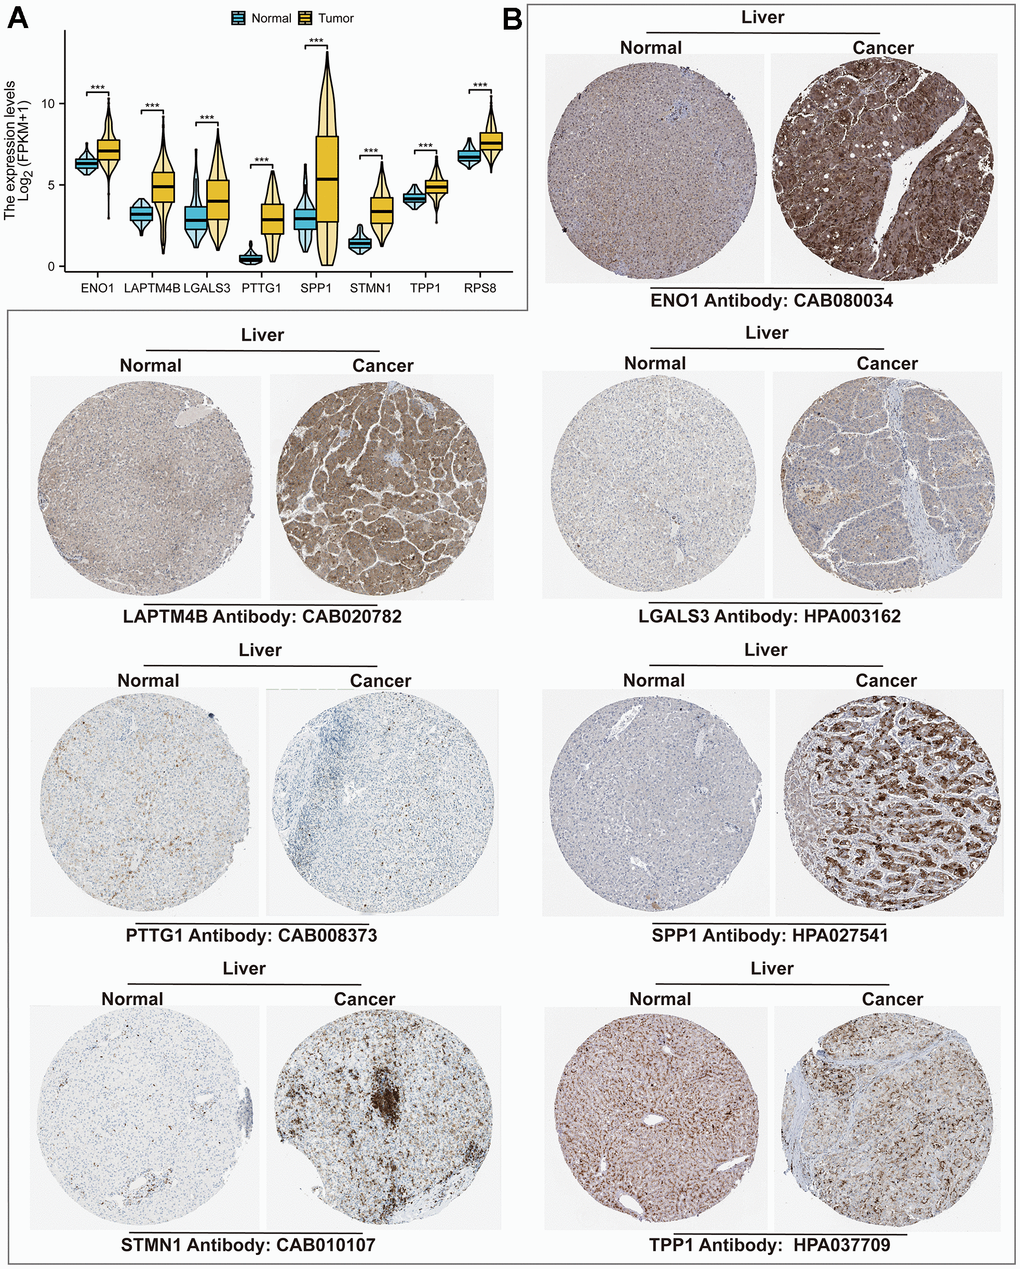
Figure 4.TRSSys-related genes in HCC. (A) Differential expression of TRSSys-related TRGs in tumor and normal tissues. (B) Immunohistochemical images of TRSSys-related TRGs in the HPA.
Figure 4 — Comprehensive assessment of regulatory T-cells-related scoring system for predicting the prognosis, immune microenvironment and therapeutic response in hepatocellular carcinoma | Aging