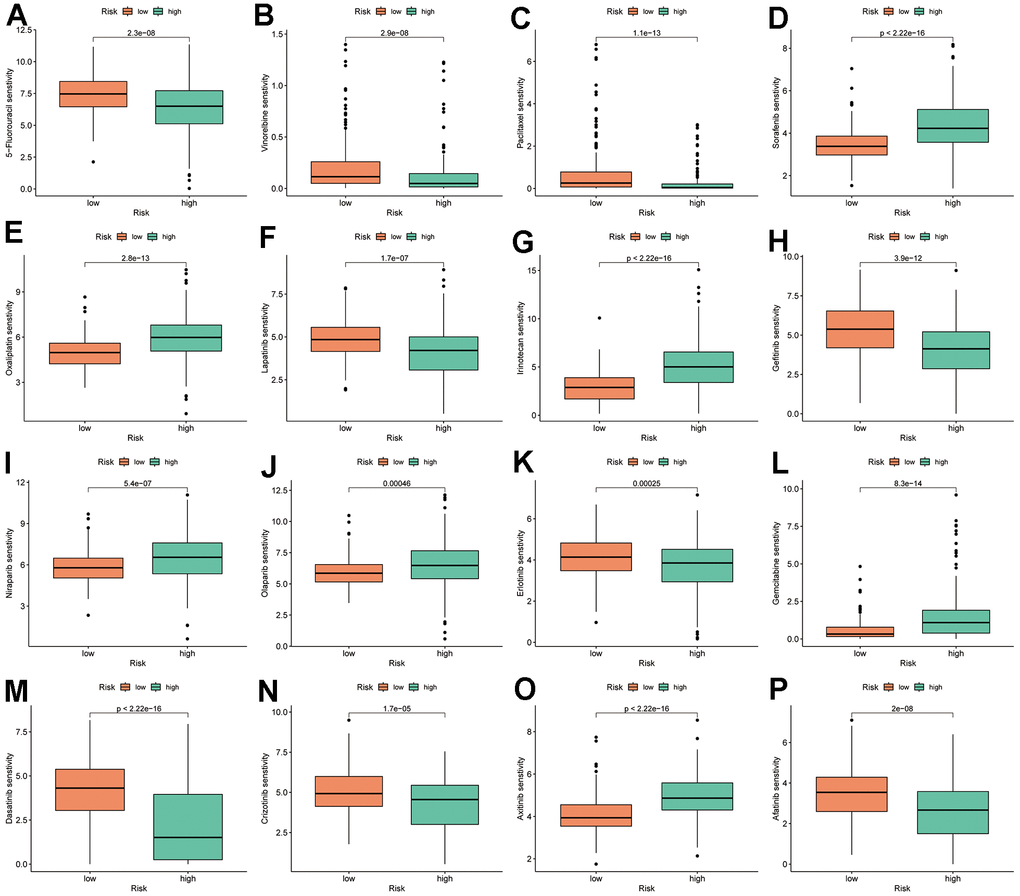
Figure 12.TRSSys-based IC50 analysis. (A–P) Therapy response of common chemotherapy and targeted drugs for risk groups.
Figure 12 — Comprehensive assessment of regulatory T-cells-related scoring system for predicting the prognosis, immune microenvironment and therapeutic response in hepatocellular carcinoma | Aging