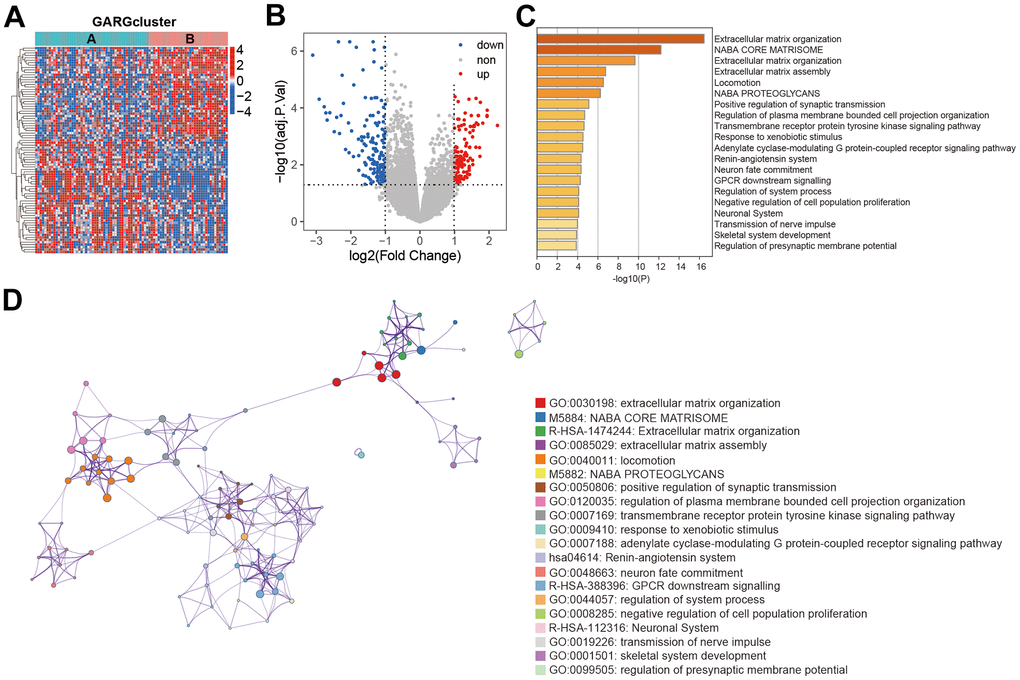
Figure 2.Functional enrichment analysis between the two subtypes. (A) Heatmap of DEGs between the two subtypes. (B) The volcano plot of DEGs. (C) Biological process and pathway enrichments ordered by statistical significance. (D) The network showed the interactions among the enriched terms.