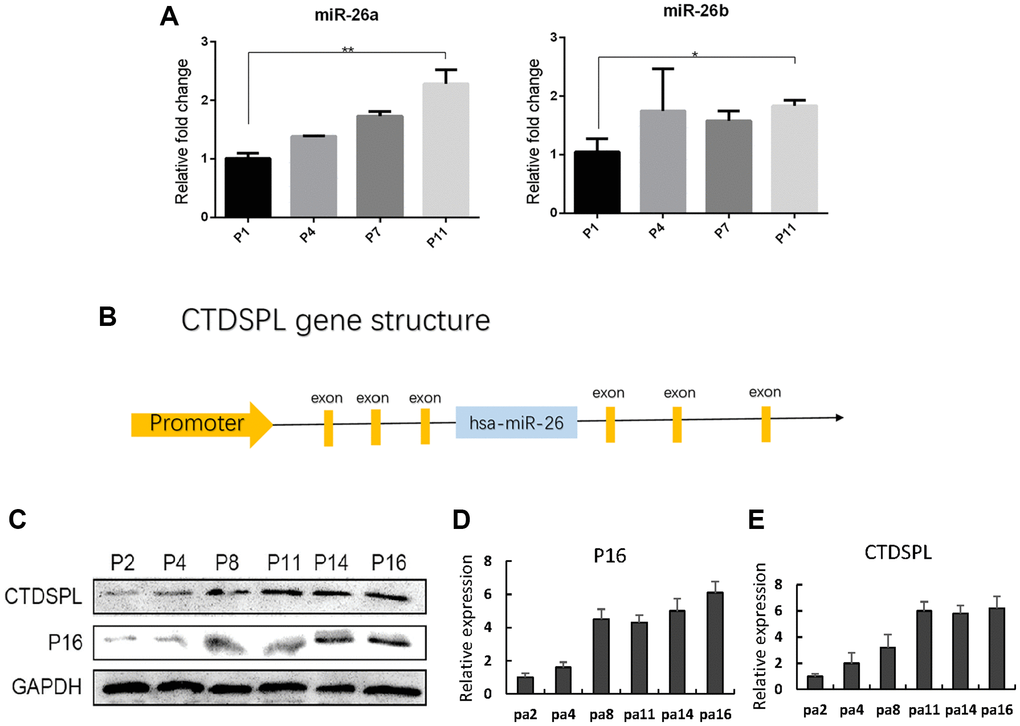
Figure 2.miR-26a/b and CTDSPL expression were up-regulated following senescence of UCMSCs. (A) Quantitative RT-PCR assay was performed to detect miR-26a and miR-26b expression in UCMSCs. (B) Gene structure of CTDSPL. (C) Western blot assay was performed to detect CTDSPL expression in UCMSCs. (D) The expression of P16 was quantized. (E) CTDSPL was also quantized. *p < 0.05; **p < 0.01.