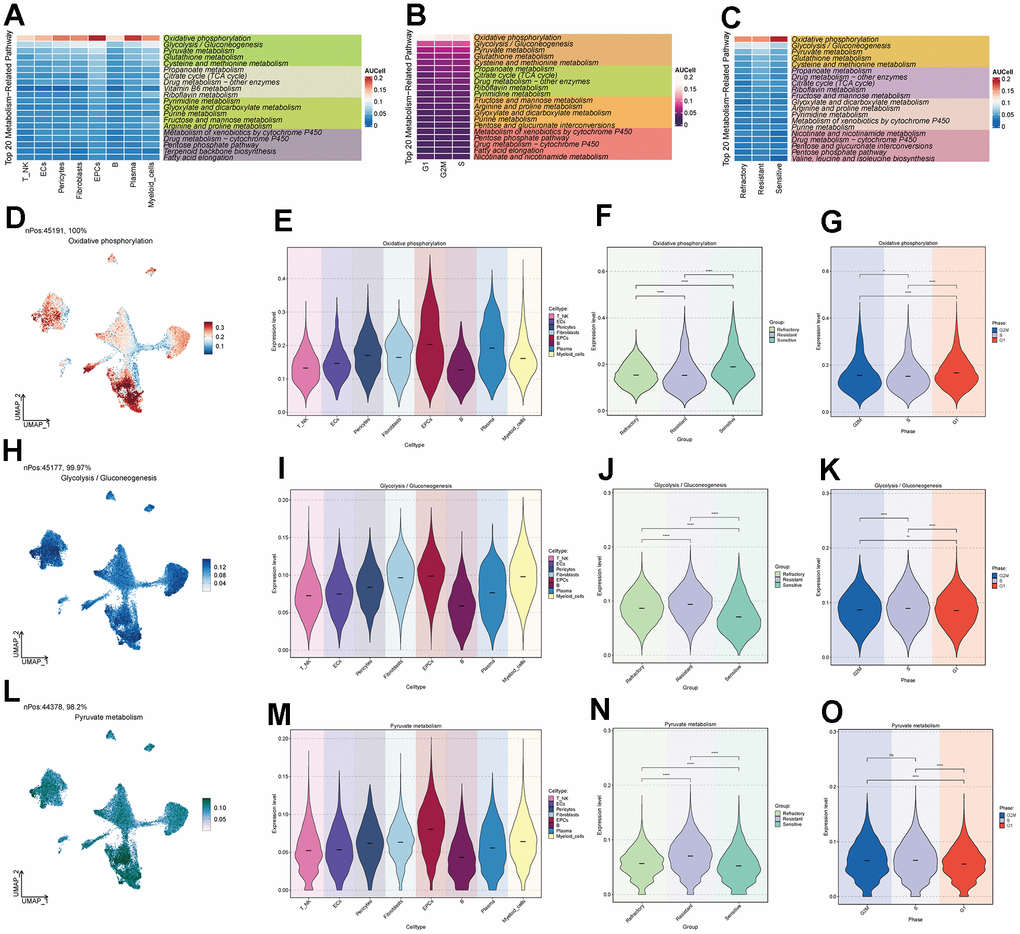
Figure 4.Metabolic pathways of major cell clusters. (A) Top 20 metabolic pathways in major ovarian cancer cell clusters. (B) Top 20 metabolic pathways in G2M, S, and G1 cell staging. (C) Top 20 metabolic pathways in the Resistant, Refractory, and Sensitive response groups. (D–O) UNMP distribution and violin plots for the Oxidative Phosphorylation, Glycolysis / Gluconeogenesis, and Pyruvate Metabolism pathways in major ovarian cancer cell clusters, cell staging, and drug response.