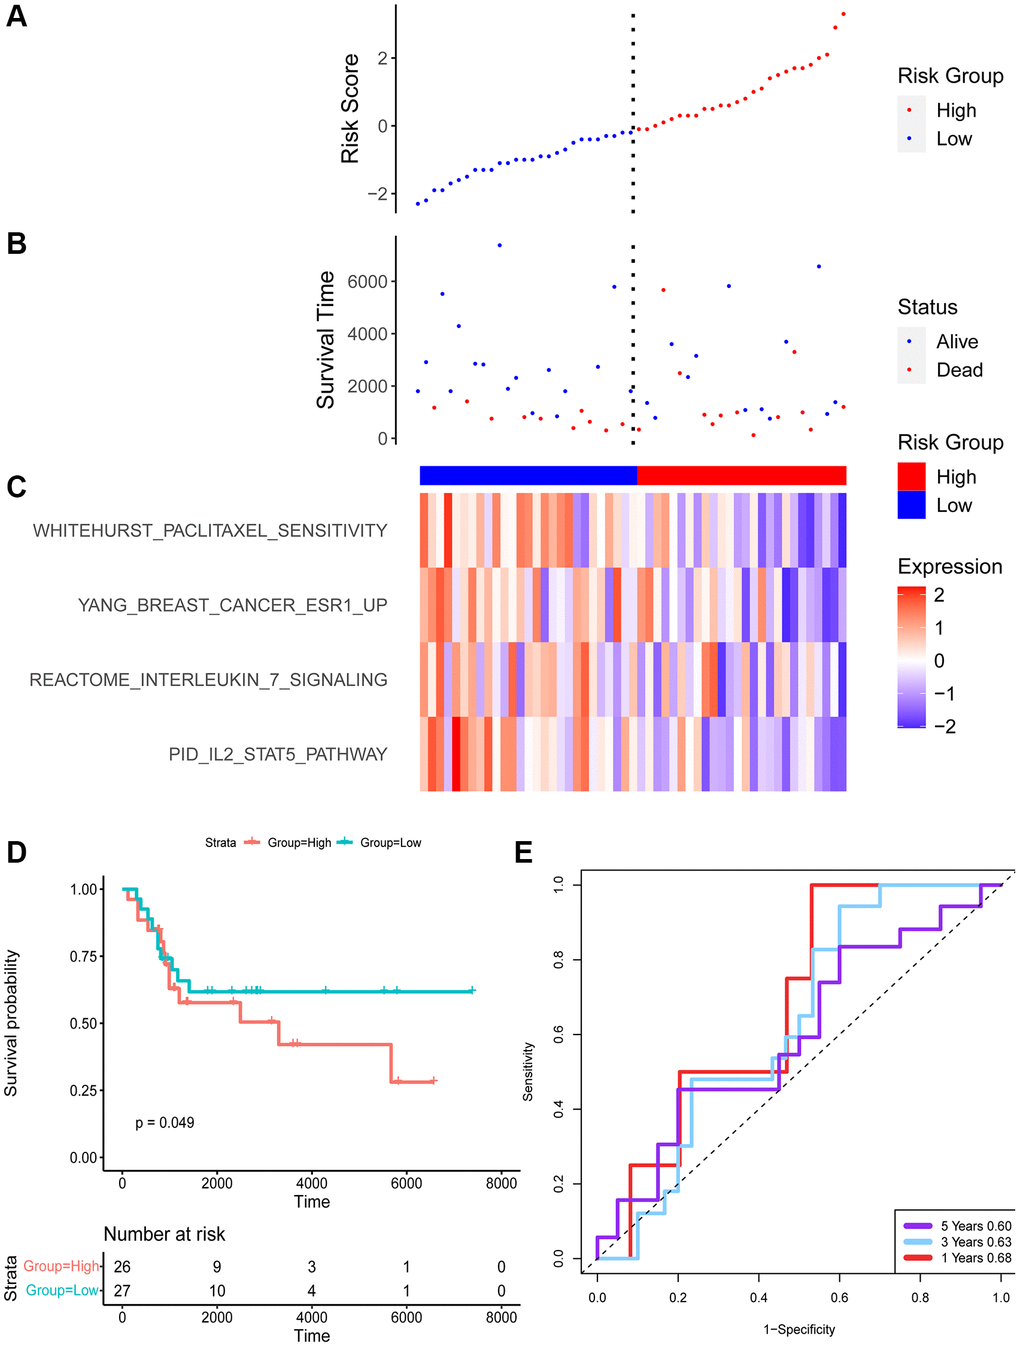
Figure 4.The risk signature of GEO datasets. Risk score (A) and survival time (B) distribution of TARGET. (C) The enrichment score of 4 pathways. (D) Survival analysis of two groups. (E) The ROC of the model.
Figure 4 — A novel classification predicts prognosis and drug sensitivity in osteosarcoma based on alterations in gene sets | Aging