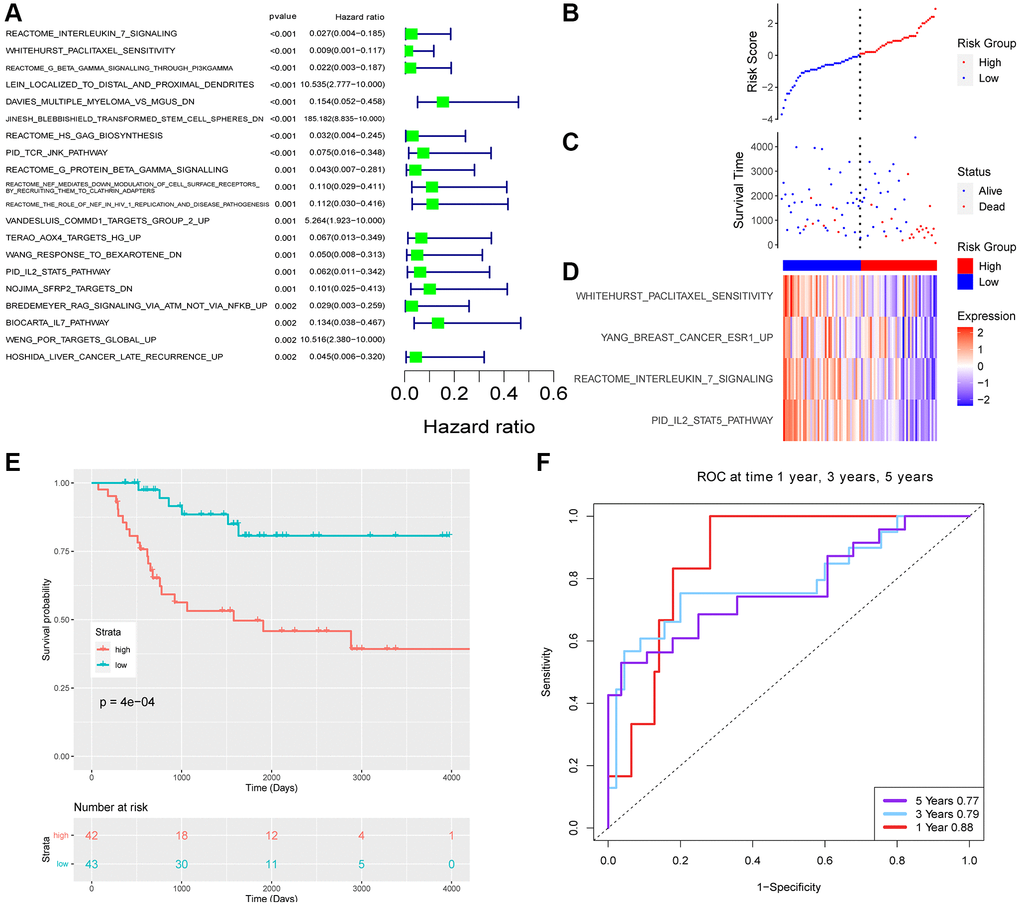
Figure 3.The risk signature of TARGET datasets. (A) Top 20 survival-related pathways with lowest p-value. Risk score (B) and survival time (C) distribution of TARGET. (D) The enrichment score of 4 pathways. (E) Survival analysis of two groups. (F) The ROC of the model.