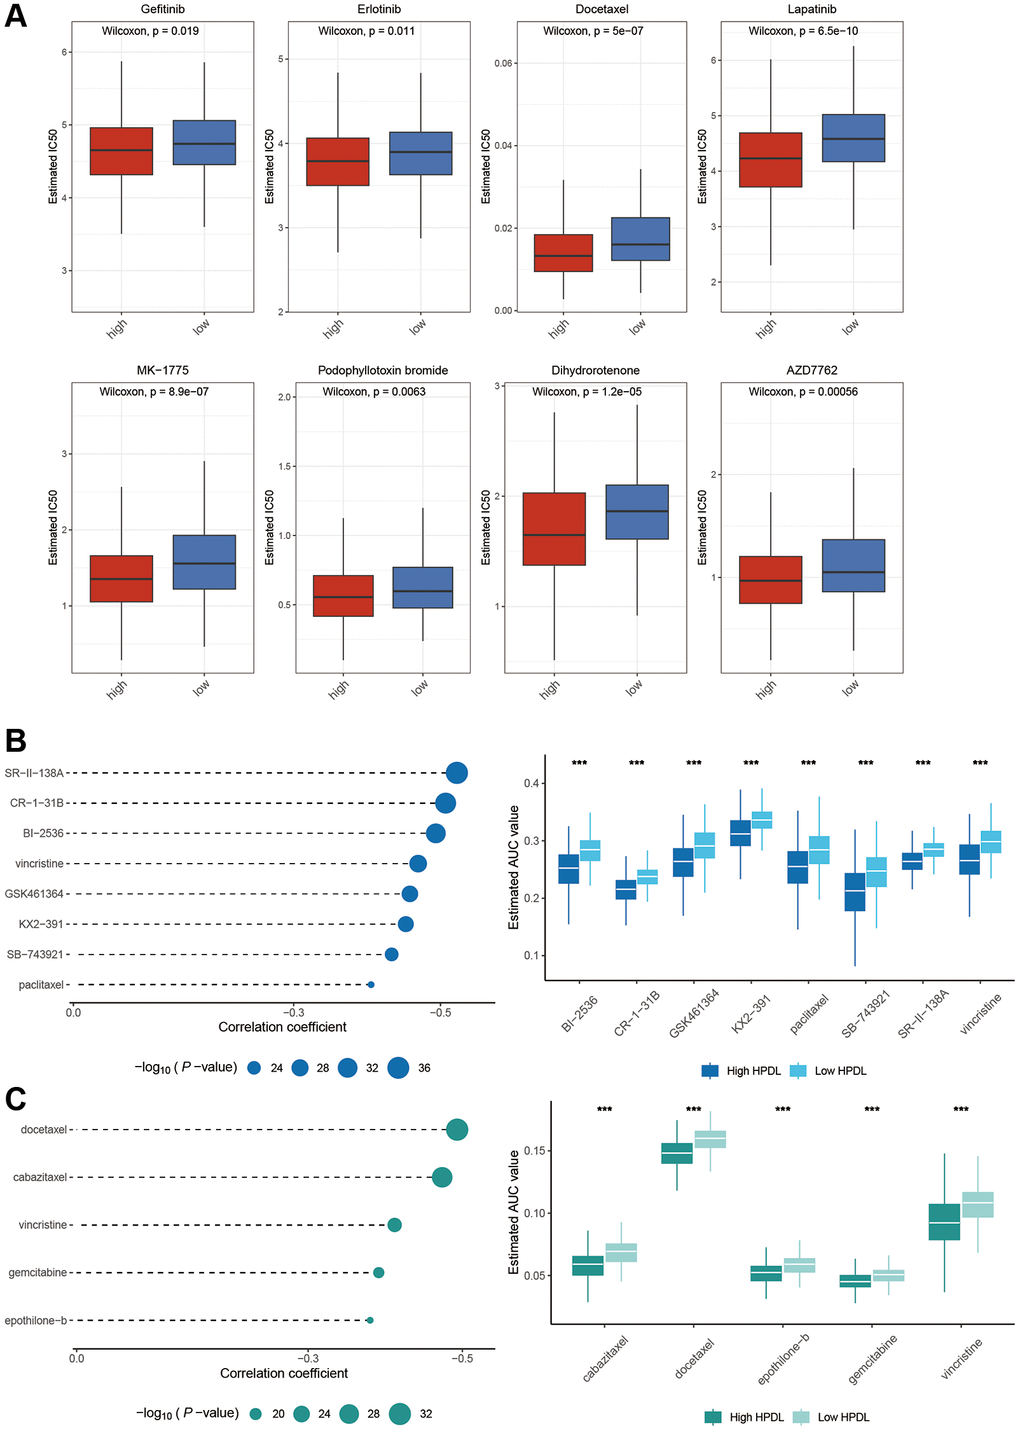
Figure 7.Identification of candidate drugs based on the expression of HPDL. (A) Estimated IC50 of the indicated molecular targeted drugs in High-HPDL and Low-HPDL group. (B, C) The results of correlation analysis and differential drug response analysis of CTRP (B) and PRISM (C) derived drugs in LUAD. The labelled asterisk indicated the statistical p-value (*p < 0.05, **p < 0.01, ***p < 0.001).