Submit an Article
Navigate
Home
Editorial Board
Editorial Policies
Current Volume
Archive
Scientific Integrity
Publication Ethics Statements
Interviews with Outstanding Authors
Newsroom
Sponsored Conferences
Podcast
Contact
Special Collections
Submit an Article
Online ISSN: 1945-4589
Research Paper
|
Volume 16, Issue 4
|
pp. 3088–3106
Exploring the effects of Dasatinib, Quercetin, and Fisetin on DNA methylation clocks: a longitudinal study on senolytic interventions
Back to article
Figure 5
(5 of 5)
−
100%
+
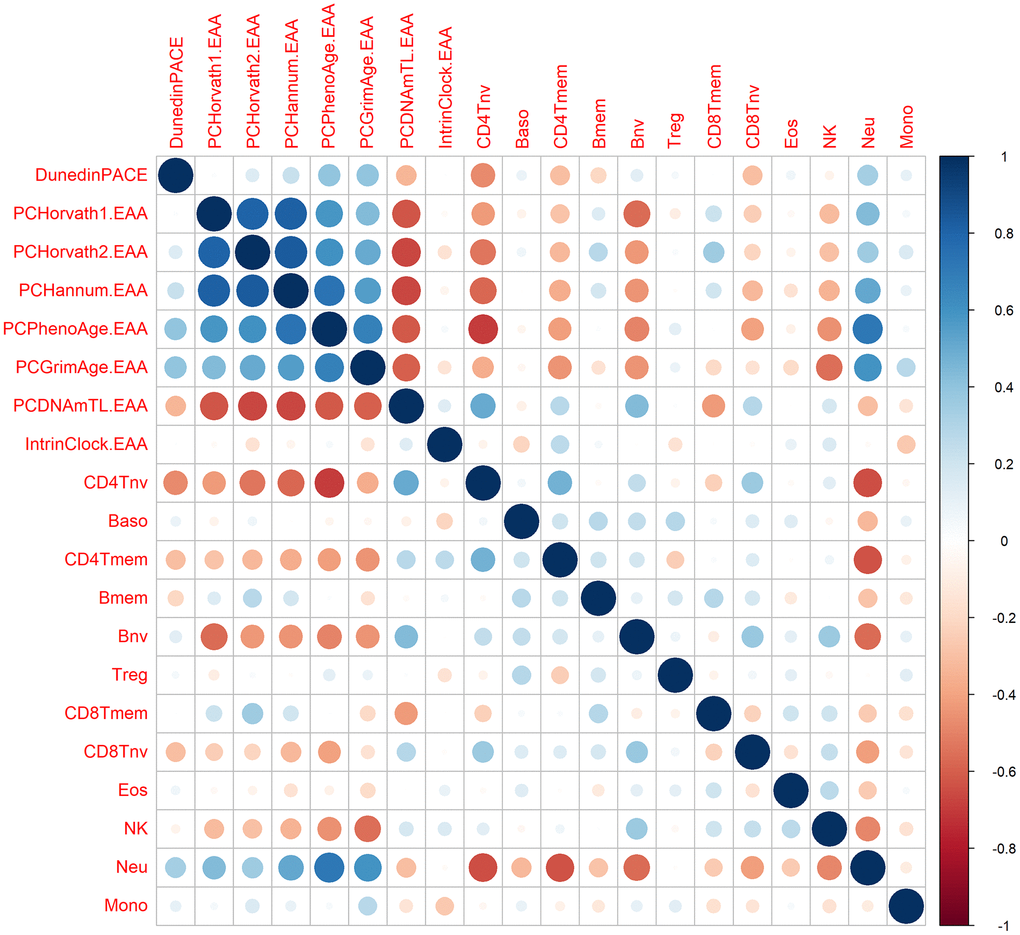
Figure 5.
Correlation between epigenetic clocks and immune cell types.
The size of the dots is proportional to the correlation value, being blue a positive correlation and red a negative correlation.