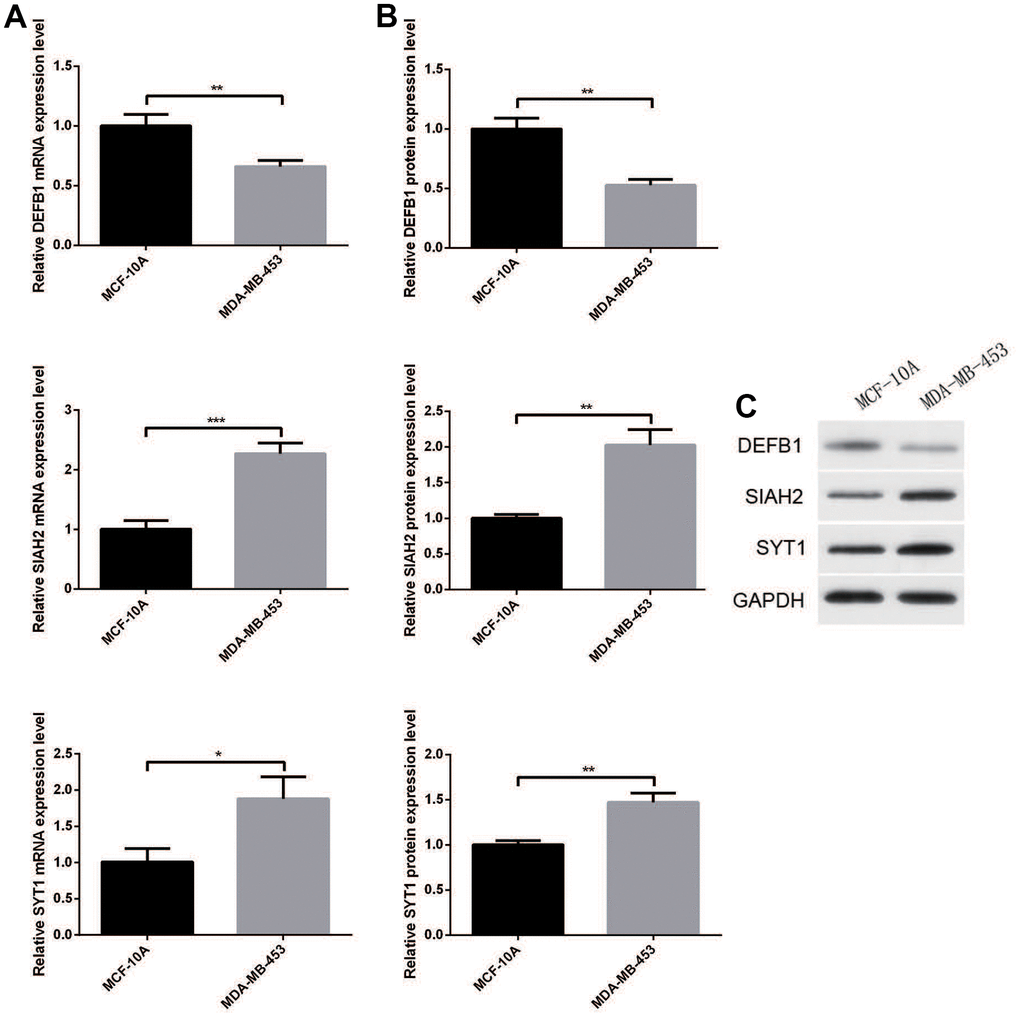
Figure 8.(A) RT-qPCR and (B, C) Western blotting analysis of DEFB1, SIAH2, and SYT1 expression in BC cell lines and adjacent cell lines. Statistical significance at different levels was reported for the results. Statistical significance at the level of * <0.05, ** <0.01, and *** <0.001.