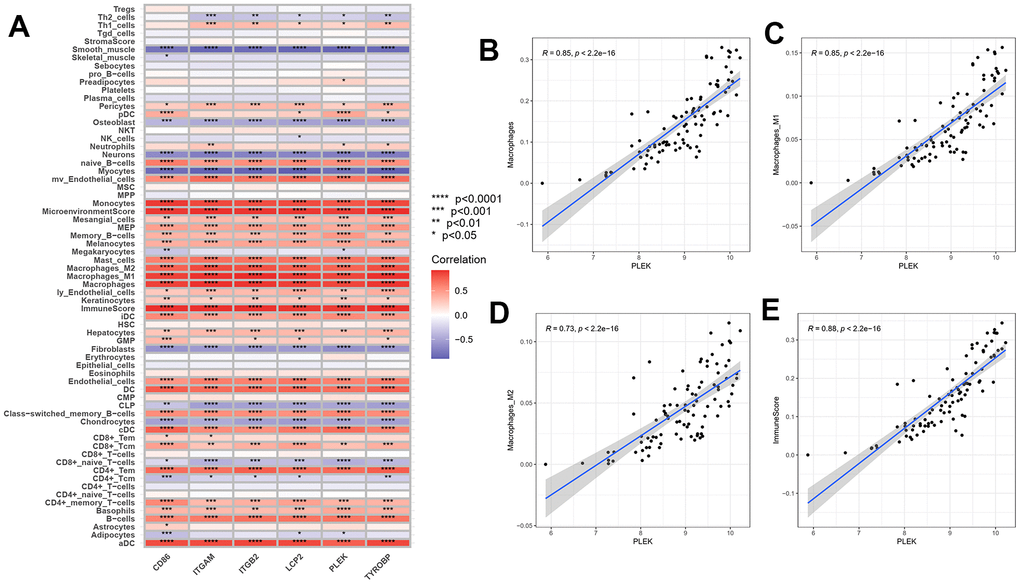
Figure 9.Correlation between gene expressions and the relative percentages of 64 cell types. (A) The heatmap of correlation between six hub genes and lymphoid cells, myeloid cells and stomal cells. (B–E) Scatterplots illustrate the exact relationship between the PLEK expression and the relative proportion of macrophages M0(R=0.85, p<2.2e-16), macrophages M1(R=0.85, p<2.2e-16), macrophages M2(R=0.73, p<2.2e-16) and immuneScore (R=0.88, p<2.2e-16).