Submit an Article
Navigate
Home
Editorial Board
Editorial Policies
Current Volume
Archive
Scientific Integrity
Publication Ethics Statements
Interviews with Outstanding Authors
Newsroom
Sponsored Conferences
Podcast
Contact
Special Collections
Submit an Article
Online ISSN: 1945-4589
Research Paper
|
Volume 16, Issue 4
|
pp. 3837–3855
Dickkopf-1 is an immune infiltration-related prognostic biomarker of head and neck squamous cell carcinoma
Back to article
Figure 3
(3 of 7)
−
100%
+
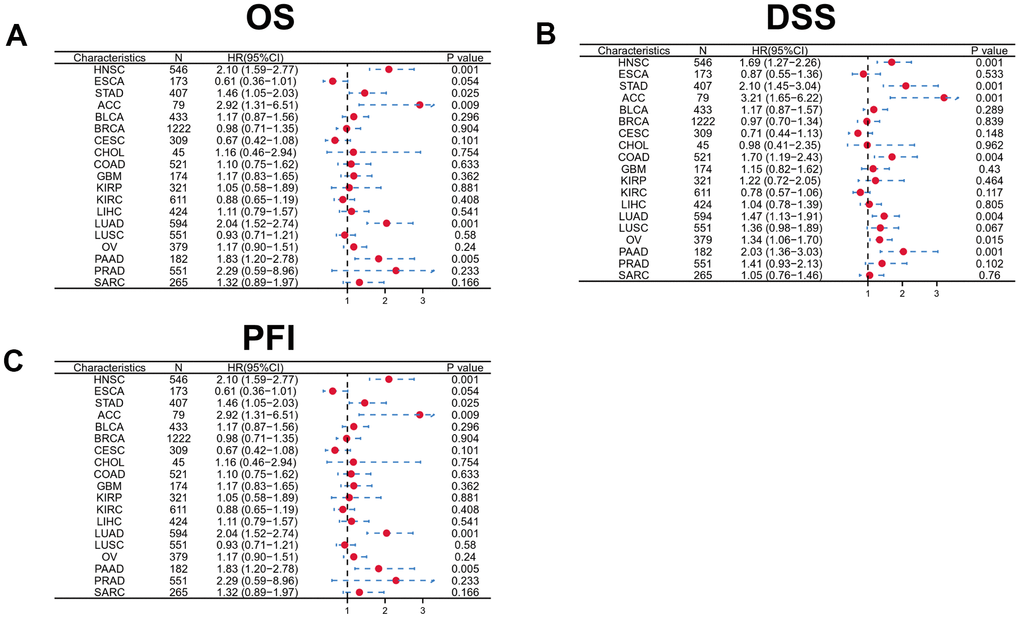
Figure 3.
Forest plot showing the prognostic significances for different cancer subgroups based on high or low DKK1 expression.
(
A
–
C
) Prognostic HRs related to DKK1 expression in various cancers in terms of OS (
A
), DSS (
B
), and PFI (
C
).