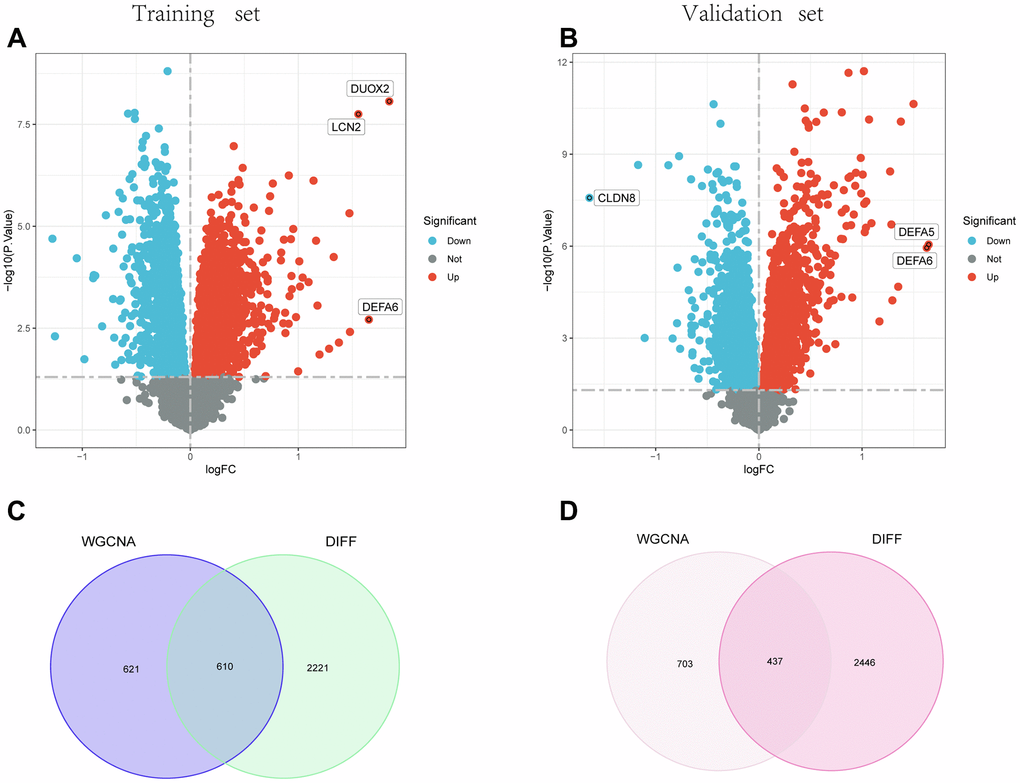
Figure 3.Identification of DEGs. (A) and (B) show the Volcano plot for DEGs between healthy controls and UC in the training and test groups, respectively. (C) and (D) Venn diagrams for intersections of DEGs and the WGCNA module in the training and test groups.