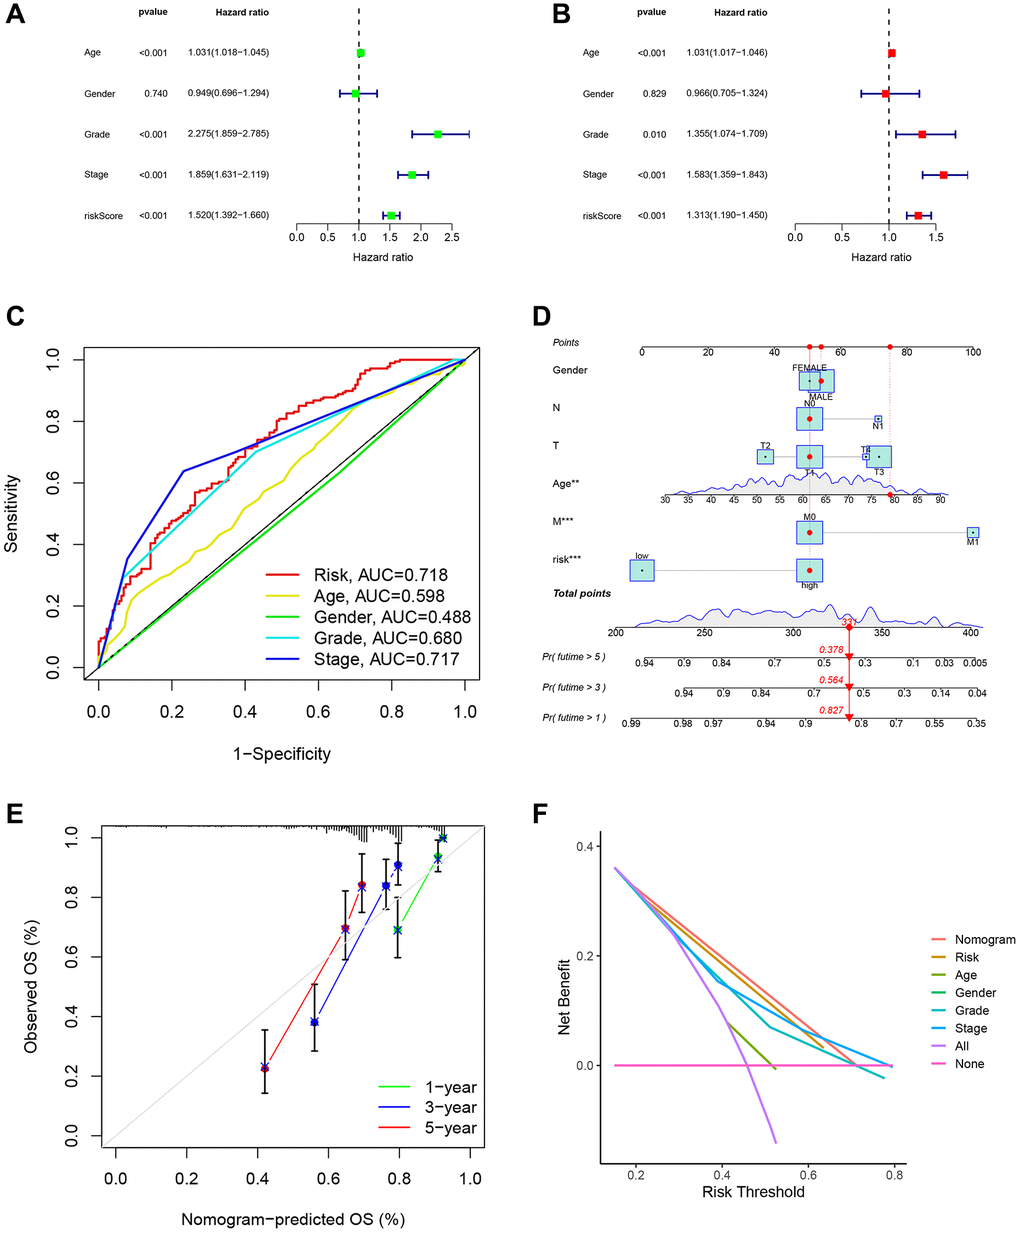
Figure 10.Analysis of the DRG risk score model and clinical indicator. (A) Univariate regression analyses demonstrated the risk model as an independent prognostic indicator. (B) Multivariate regression analyses demonstrated the risk model as an independent prognostic indicator. (C) The clinROC curves with risk score models and common clinical indicators. (D) The nomogram predicted patient OS in the 1st, 3rd, and 5th years. (E) The calibration curves displayed the accuracy of the nomogram in the 1st, 3rd, and 5th years. (F) The DCA analysis of different indicators.