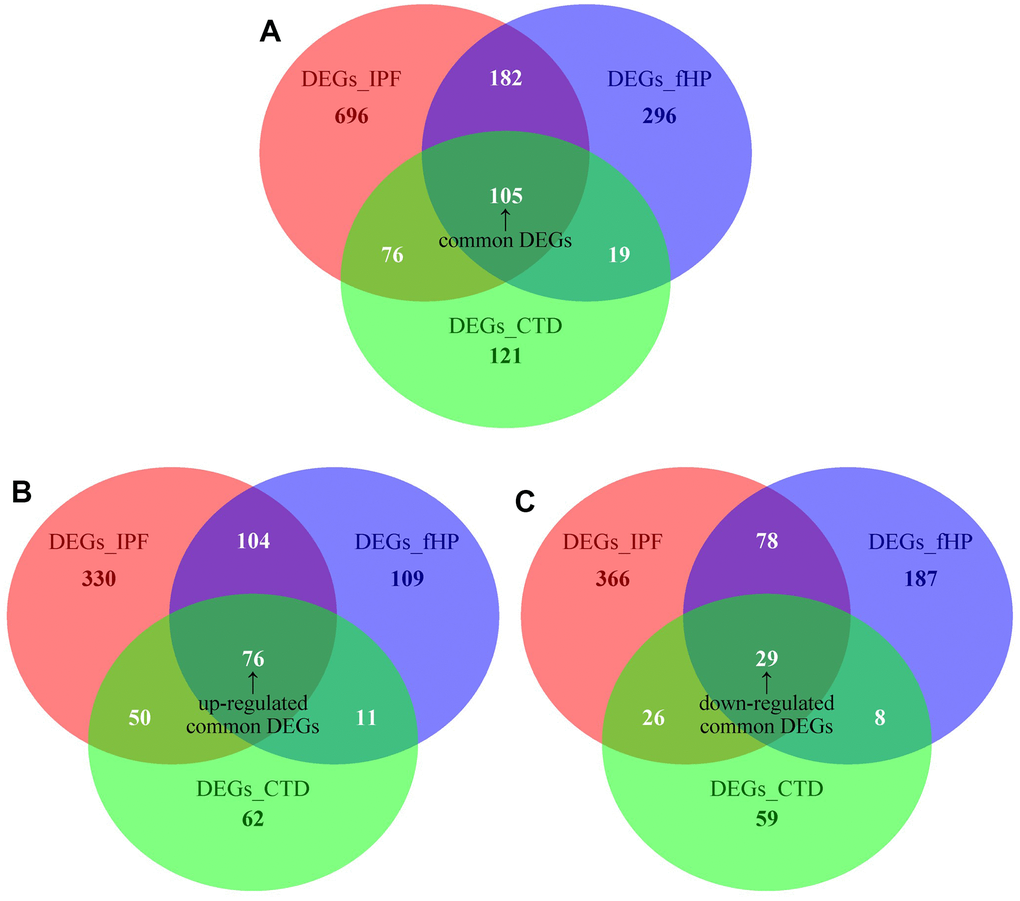
Figure 2.(A) Venn diagram demonstrates the common DEGs of fHP, IPF and CTD-ILD. (B, C) Venn diagrams demonstrate the up-regulated and down-regulated common DEGs of fHP, IPF and CTD-ILD, respectively.
Figure 2 — Transcriptomic and network analysis identifies shared and unique pathways and immune changes across fibrotic interstitial lung diseases | Aging