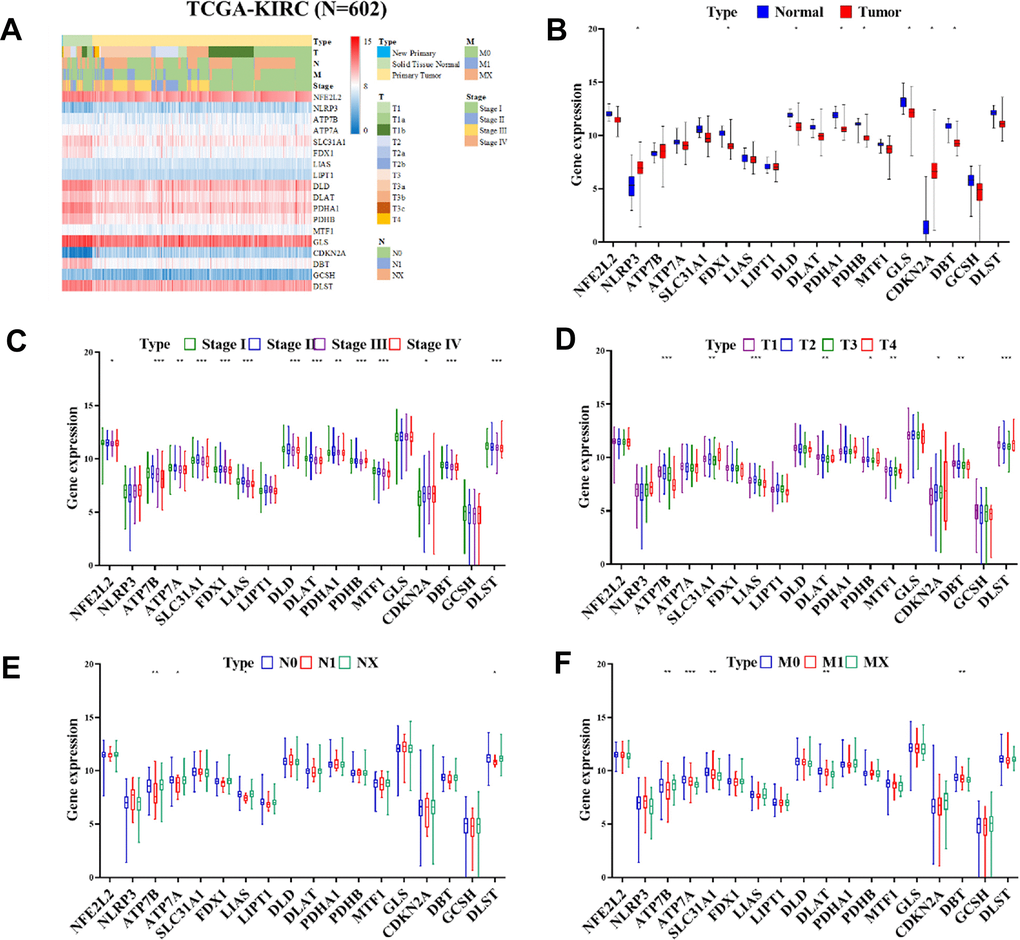
Figure 3.Heatmap displaying the differential expression of CRGs expression in progression of ccRCC. (A) Heatmap displaying the differential expression of CRGs in normal tissues in TCGA-KIRC cohort (n = 602). (B) Expression of CRGs in normal tissues and tumors samples from the TCGA-KIRC cohort by (C) stage, (D) Tumor, (E) Node, and (F) Metastasis.