Submit an Article
Navigate
Home
Editorial Board
Editorial Policies
Current Volume
Archive
Scientific Integrity
Publication Ethics Statements
Interviews with Outstanding Authors
Newsroom
Sponsored Conferences
Podcast
Contact
Special Collections
Submit an Article
Online ISSN: 1945-4589
Research Paper
|
Volume 16, Issue 3
|
pp. 2617–2637
A study on the role of Taxifolin in inducing apoptosis of pancreatic cancer cells: screening results using weighted gene co-expression network analysis
Back to article
Figure 4
(4 of 11)
−
100%
+
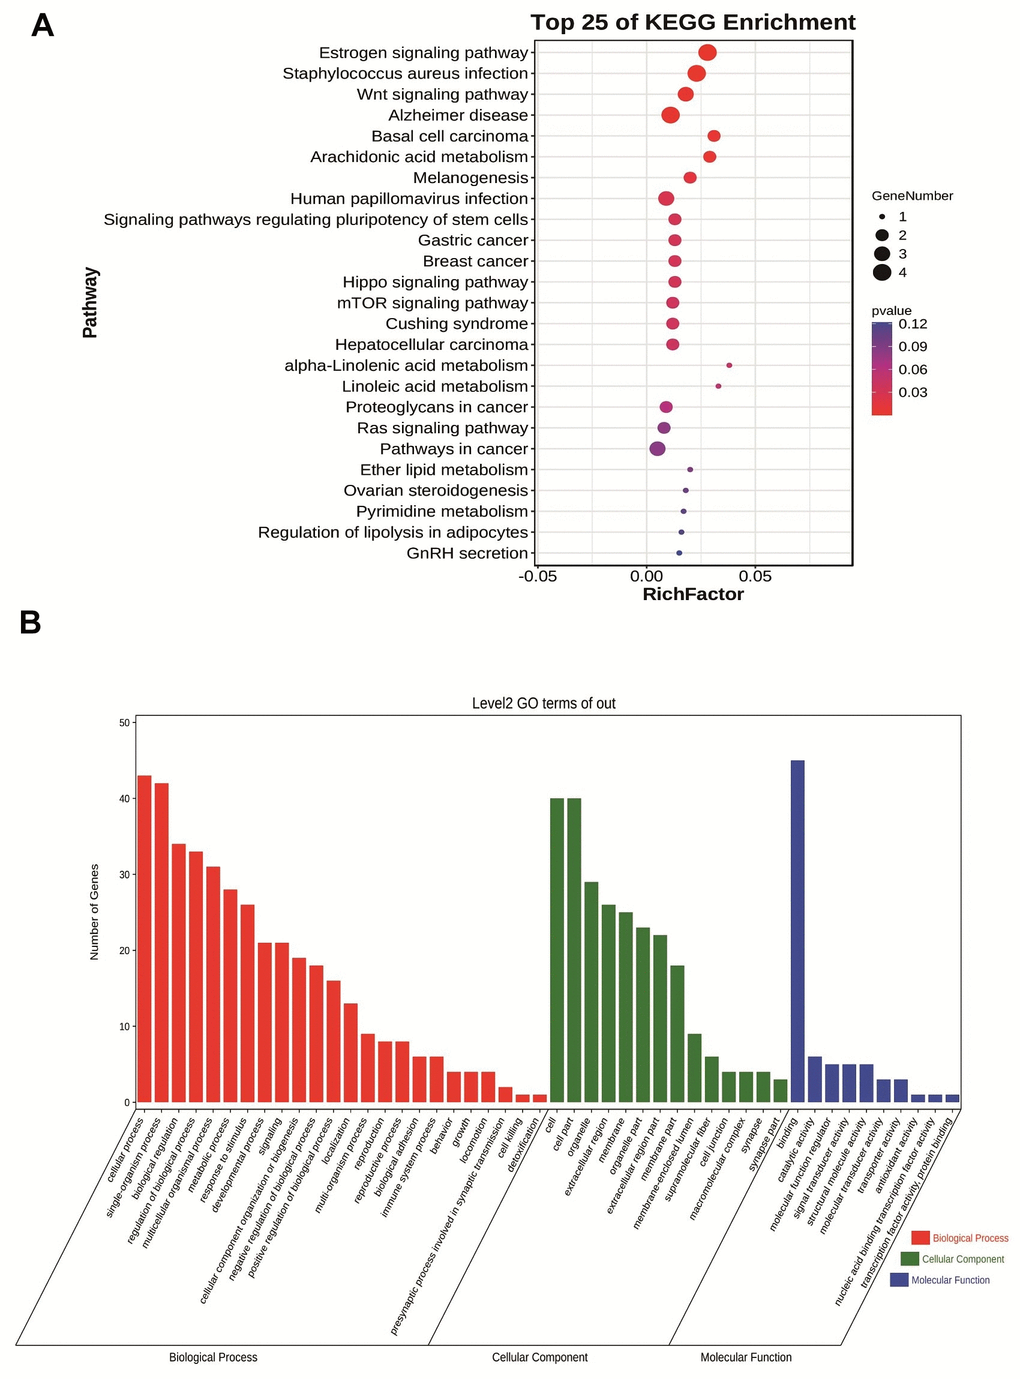
Figure 4.
(
A
) Bubble plot of KEGG enrichment analysis of module feature genes in Navajowhite module. (
B
) Category histogram of the GO enrichment analysis of feature genes within the Navajowhite module.