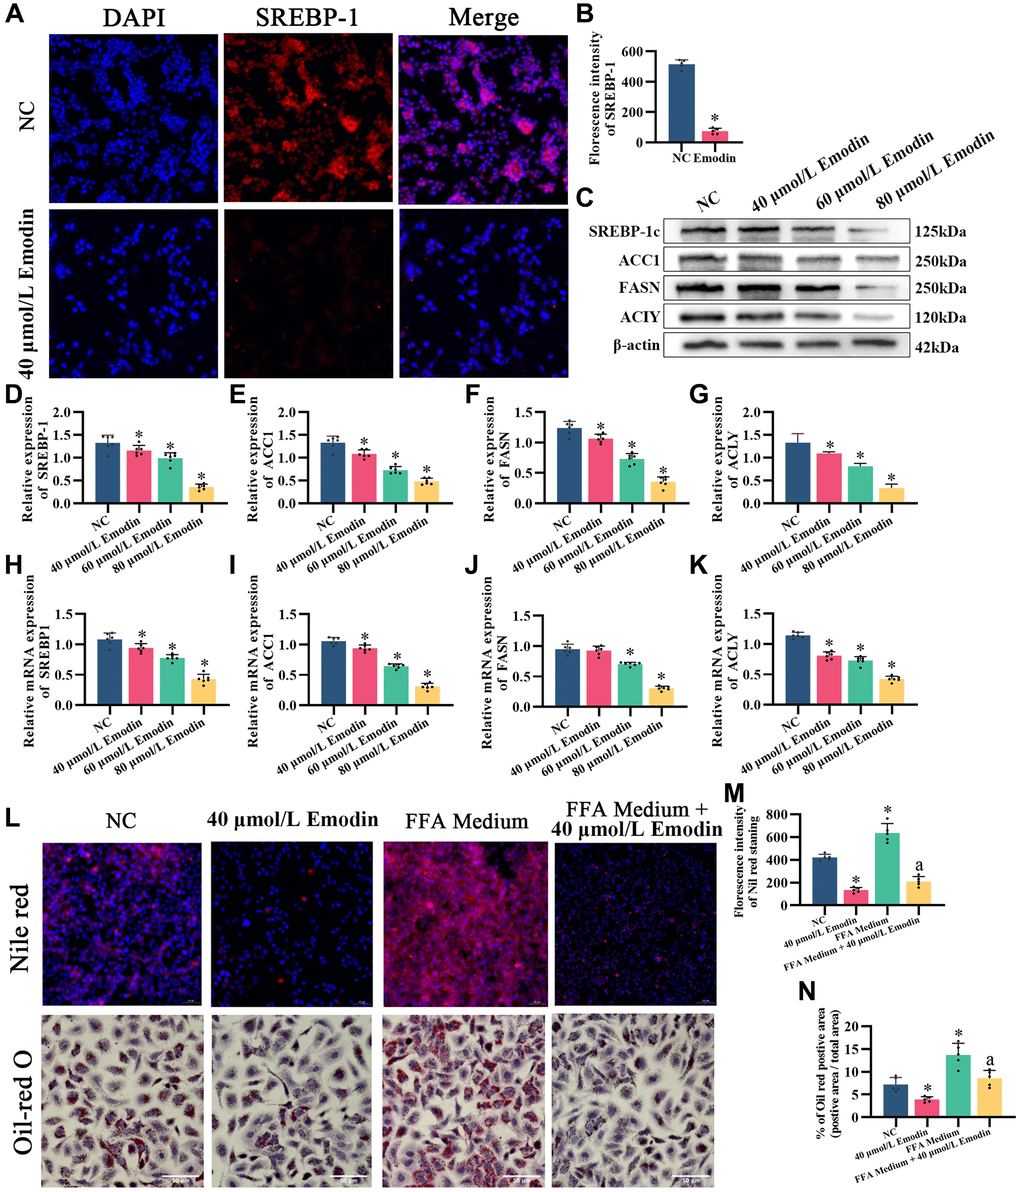
Figure 7.Emodin mediates the AMPK signaling pathway in HepG2 cells. (A) IF staining of SREBP-1. (B) Florescence intensity analysis of SREBP-1, ×200. (C) Representative Western blot of SREBP-1, ACC1, FASN, and ACLY. (D–G) Western blot analysis. (H–K) Relative mRNA levels of SREBP-1, ACC1, FASN, and ACLY (ratio: measured mRNA/GAPDH mRNA). (L–N) Nile red and Oil red O staining and analysis. *indicates comparison with NC, P < 0.05. A indicates a comparison with FFA Medium, P < 0.05. The white line indicates 50 μm.