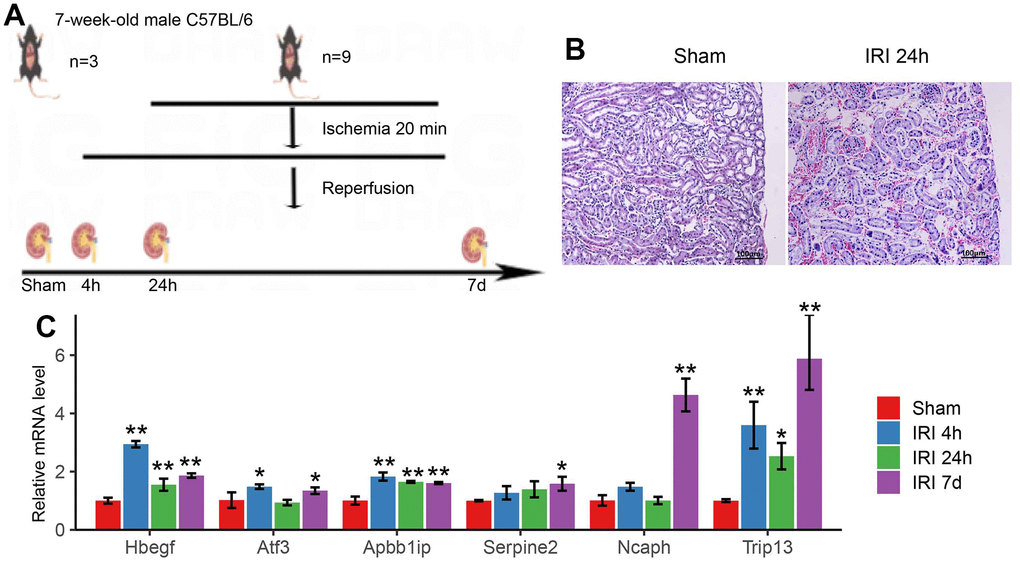
Figure 8.(A) The schematic graph of the mouse IRI model. (B) Pathological changes of renal tissue in 24h of IRI. (C) The qRT-PCR results of hub genes in the mouse IRI group and the normal group. * p<0.05, **p<0.01.
Figure 8 — Identification of renal ischemia reperfusion injury-characteristic genes, pathways and immunological micro-environment features through bioinformatics approaches | Aging