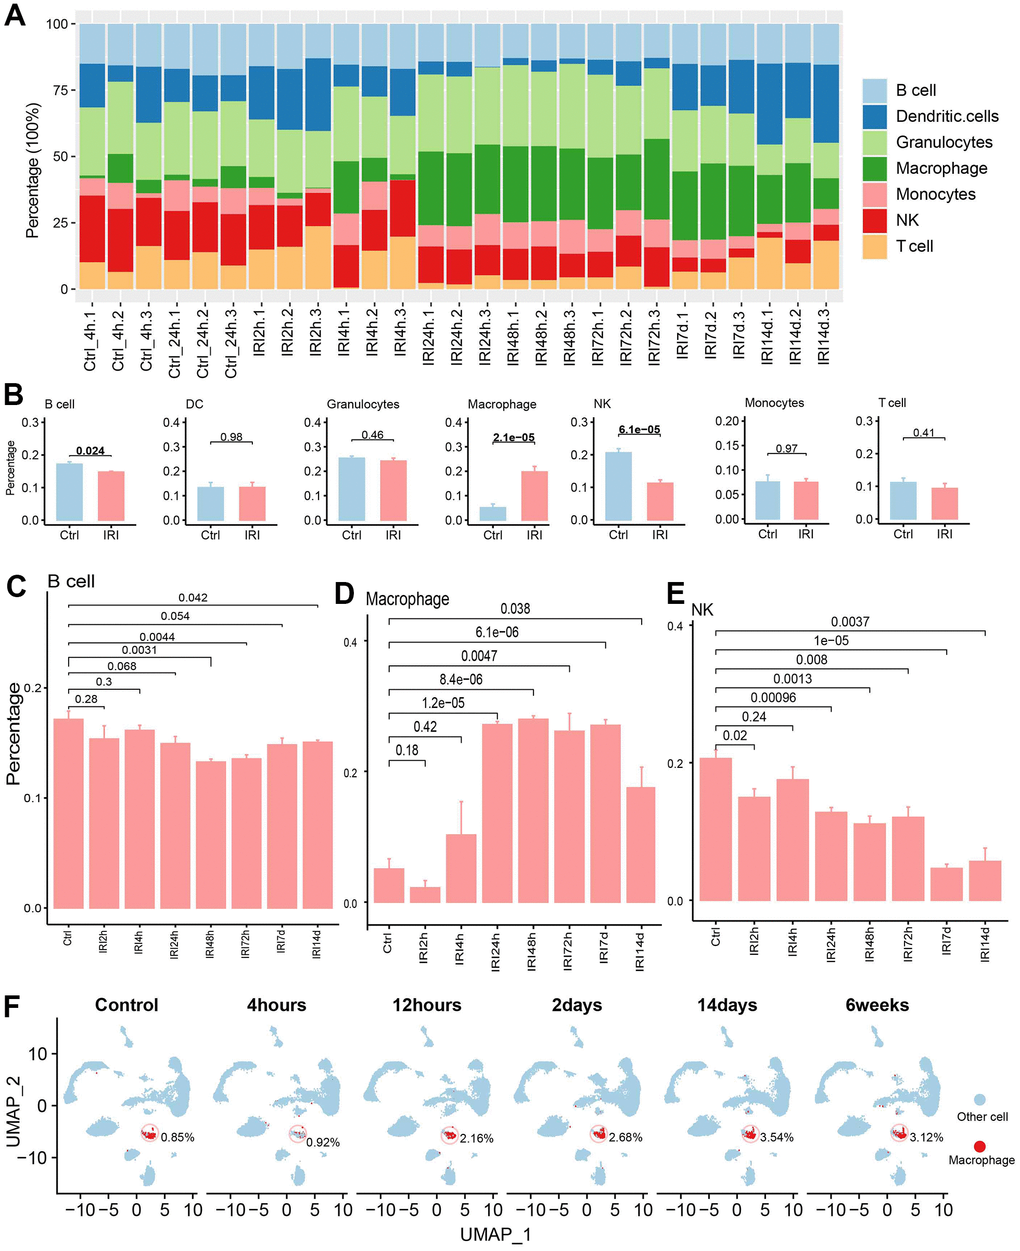
Figure 6.The immune cell infiltration analysis. (A) The immune cell abundance in each sample. (B) The immune cell abundance difference between the control and IRI groups. (C) The B cell abundance difference between the control and each IRI group. (D) The macrophage abundance difference between the control and each IRI group. (E) The T cell abundance difference between the control and each IRI group. (F) The abundance of macrophages across different IRI stages in GSE139107 using UMAP plot.