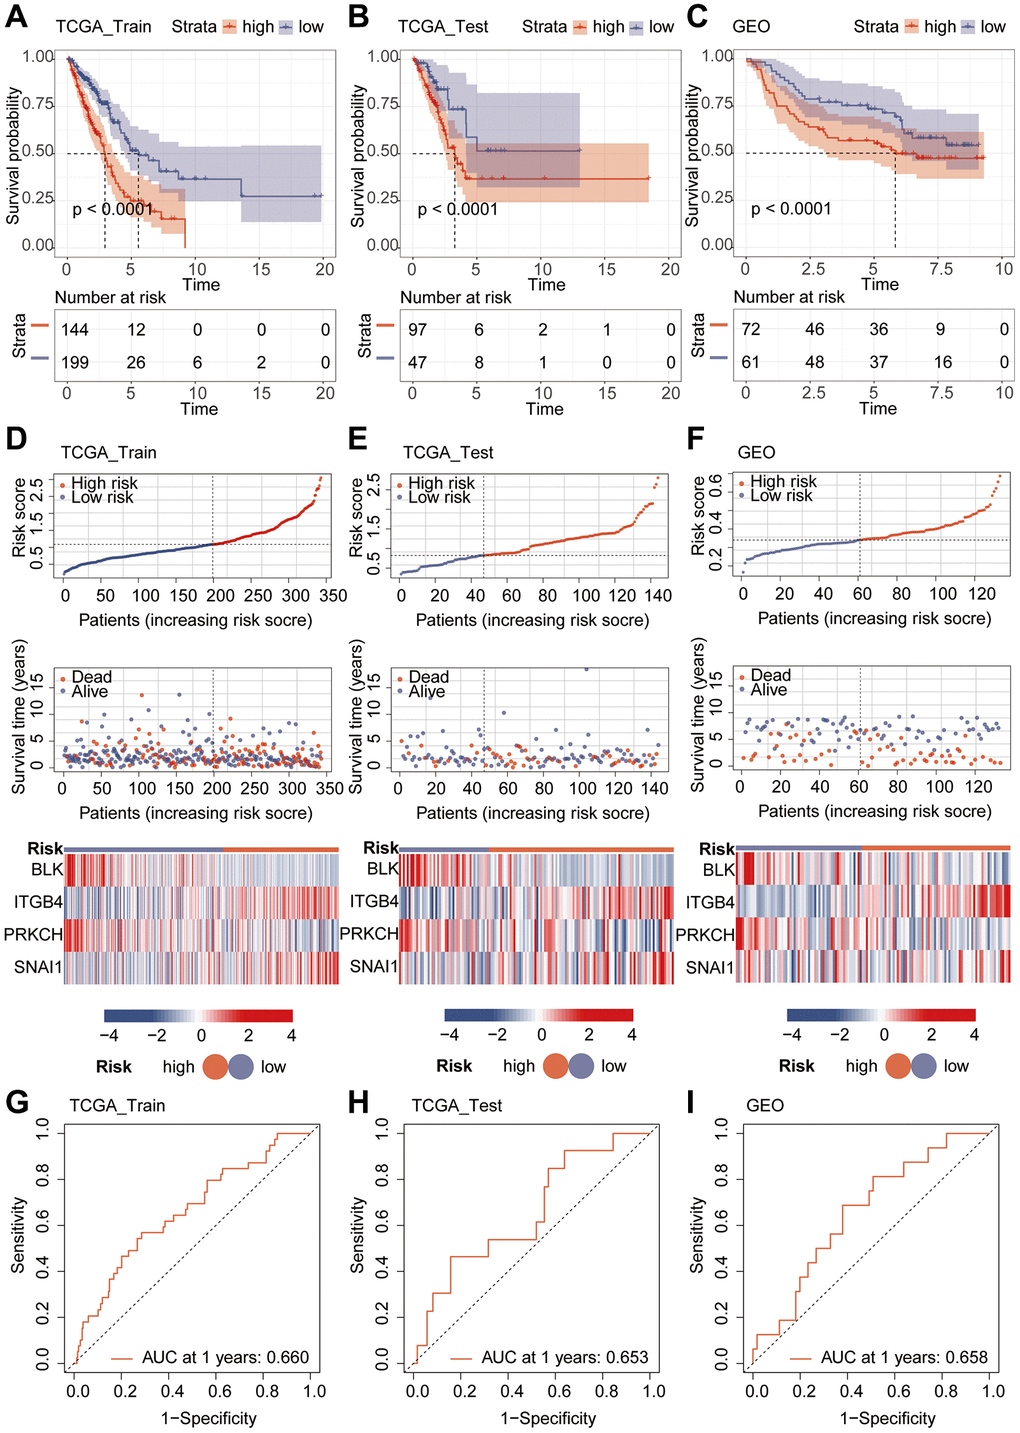
Figure 4.Validation of model performance. (A–C) Prognostic analysis using Kaplan-Meier curves for the riskScore model. (D–F) Heatmap and risk curve analysis of the riskScore model. (G–I) ROC analysis of the riskScore Model.
Figure 4 — The integration of multi-omics analysis and machine learning for the identification of prognostic assessment and immunotherapy efficacy through aging-associated genes in lung cancer | Aging