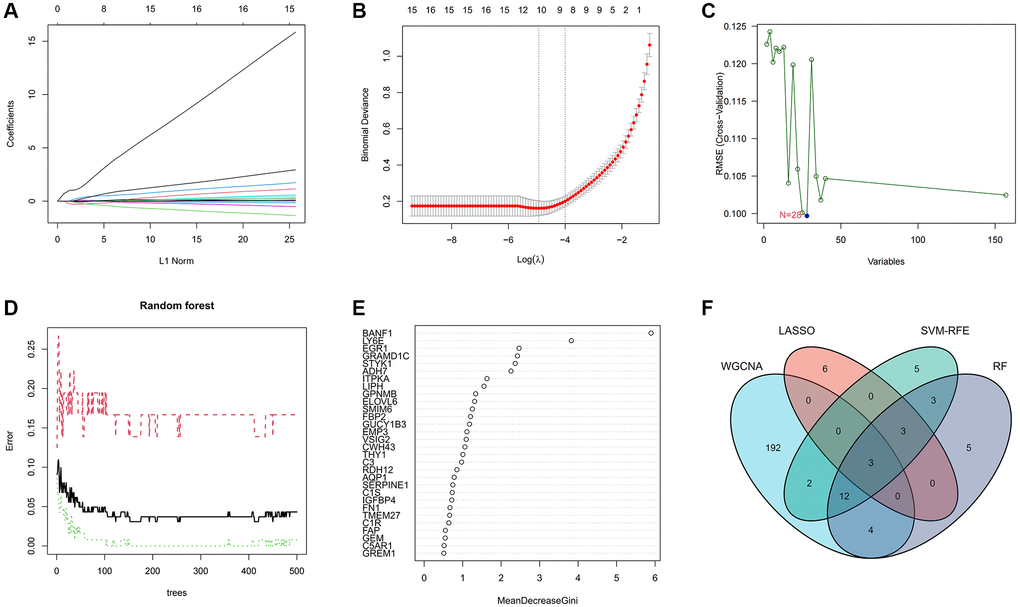
Figure 3.Machine learning screens for disease characterizing genes. (A, B) LASSO regression analysis screening variables. (C) Cross-validation error rate graph based on SVM-RFE. (D, E) Genes were scored using a random forest algorithm to rank genes by importance algorithm. (F) VEEN graph to obtain the intersection of key genes screened by the 4 methods.