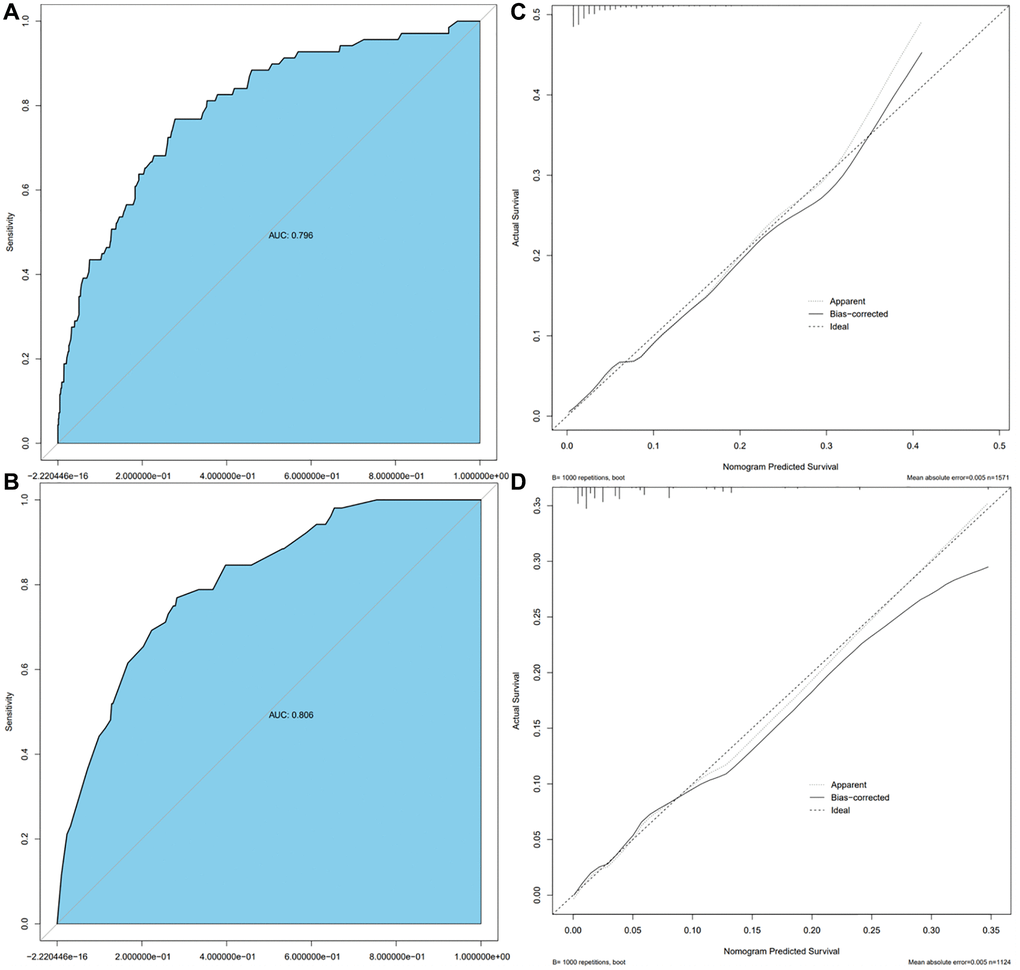
Figure 3.Calibration curve and ROC curve. Discrimination of the nomogram was evaluated by the ROC curve, AUC = 0.796 in the Ra cohort (A), AUC = 0.806 in the Ha cohort (B); calibration curves illuminate the agreement between the predicted risks of TFE3-RCC (C) and the observed incidence of TFE3-RCC (D). The dotted line represents the ideal flawless model.