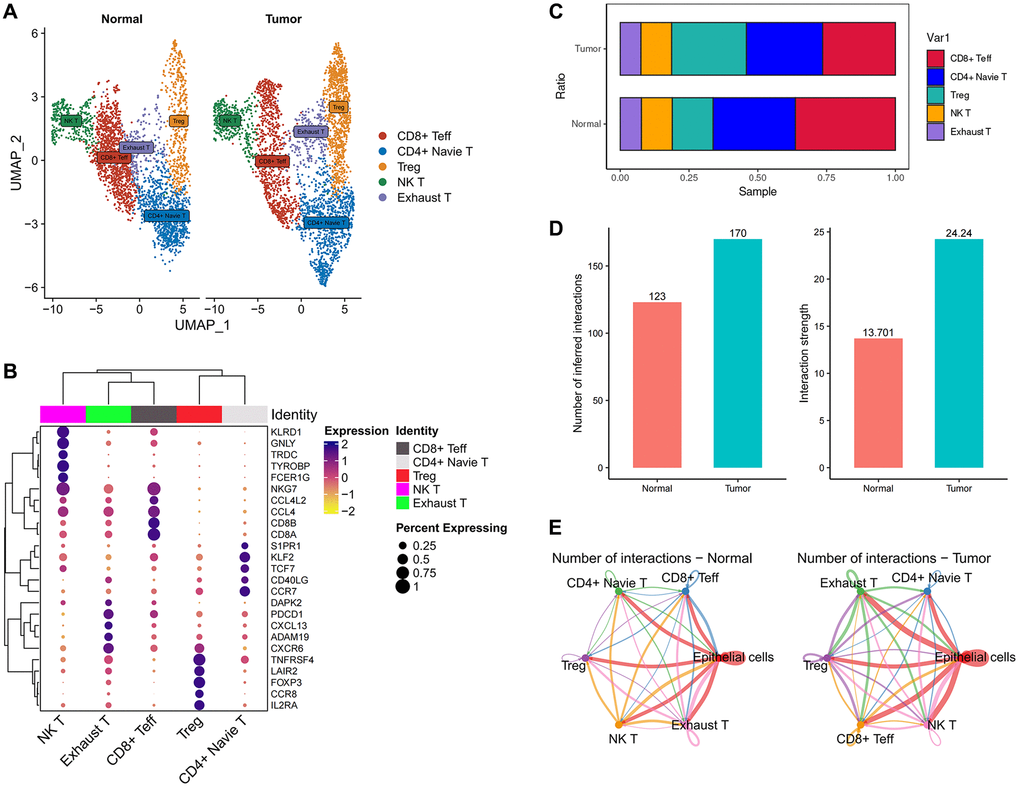
Figure 5.The immune landscape of T cells in esophageal cancer. (A) UMAP plot showing the subtypes of T cells. (B) Dotplot showing marker gene expression in indicated cell types. (C) Histograms indicating the proportion of T cells subtypes in tumor tissue and normal tissue. (D) Histograms indicating the cellular communication strength and quantity in tumor tissue and normal tissue. (E) Cell-Chat reveals possible cell-to-cell interactions.