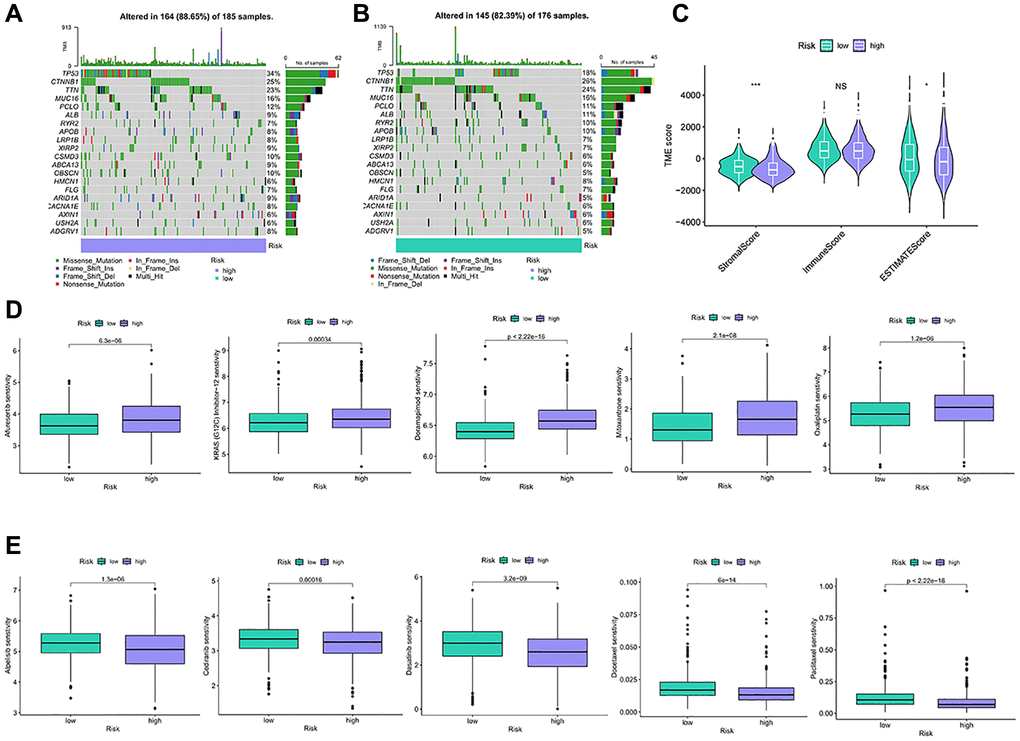
Figure 7.TMB and drug sensitivity between different risk characteristic groups. (A, B) The diagram shows gene mutations in high and low risk groups. (C) Analysis of tumor microenvironment components between risk characteristic groups. (D, E) Sensitivity analysis of chemotherapeutic drugs between different risk groups. NS p > 0.05, *p < 0.05, **p < 0.01, ***p < 0.001.