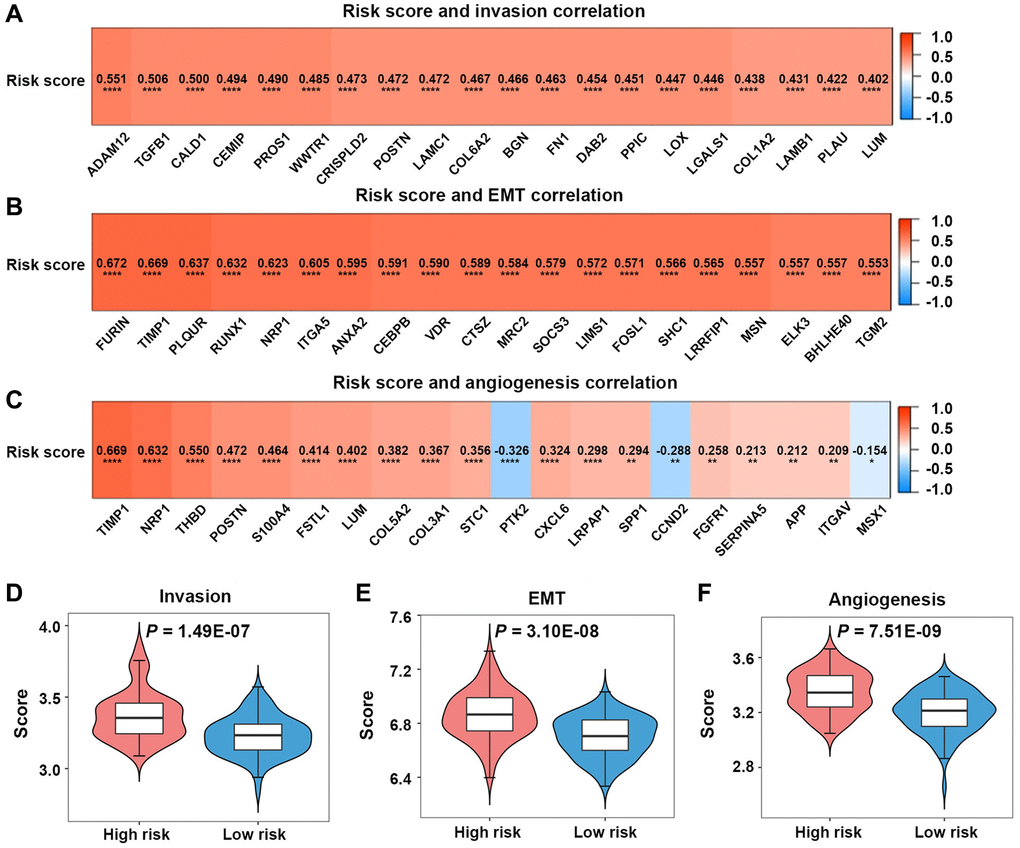
Figure 7.Invasion, epithelial-mesenchymal transition (EMT), and angiogenesis analyses in the high-risk and low-risk groups. (A–C) Relationships between risk scores and invasion-, EMT-, angiogenesis-related genes. (D–F) Comparison of invasion, EMT, and angiogenesis scores between the two groups.