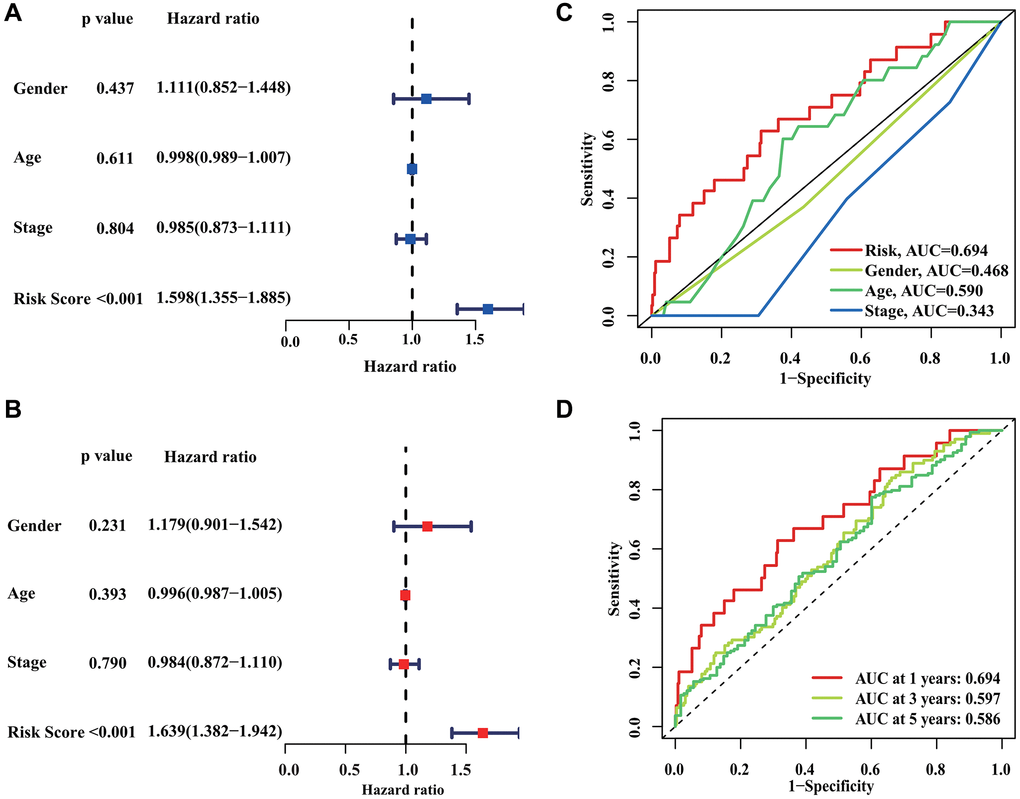
Figure 5.Independent prognostic analysis of CRIRLs score. (A, B) HR and P values of CRIRLs score and different clinical pathological features were evaluated based on univariate and multivariate Cox analyses. (C) Diagnostic effectiveness evaluation of CRIRLs score and clinical pathological features. (D) Time-dependent ROC curve shows the 1-, 3-, and 5-year AUC.