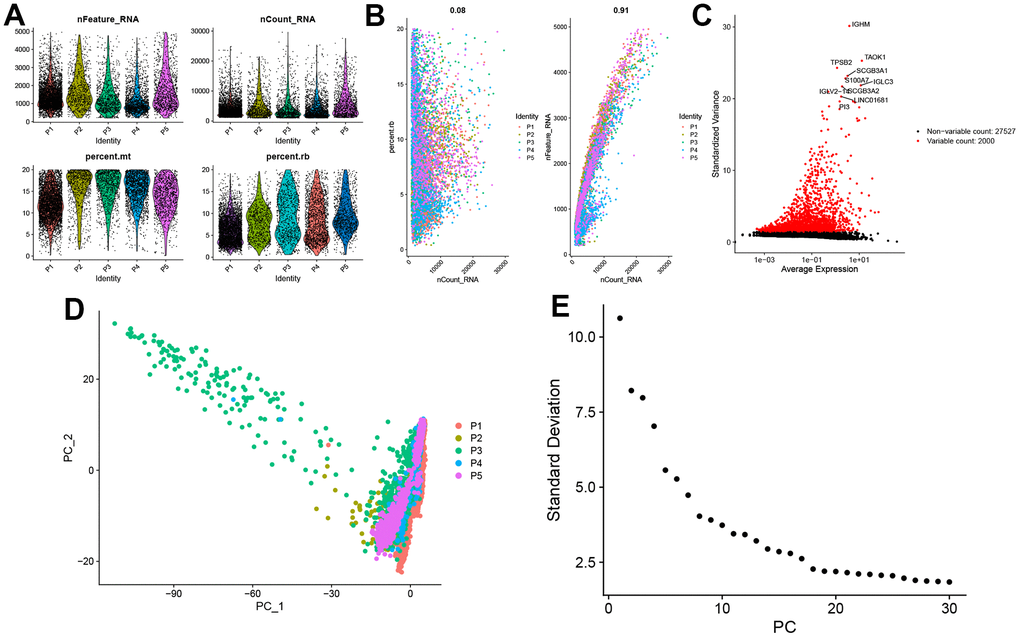
Figure 5.Single-cell sequencing data quality control and dimensionality reduction. (A) Relationship between mRNA/UMI/mitochondrial content/rRNA content of each sample after filtration. (B) The relationship between rRNA and UMI, and the relationship between mRNA and UMI; (C) The volcano map of the top 2000 hypervariable genes; (D) PCA dimensionality reduction sample distribution map; (E) PCA anchor point map.