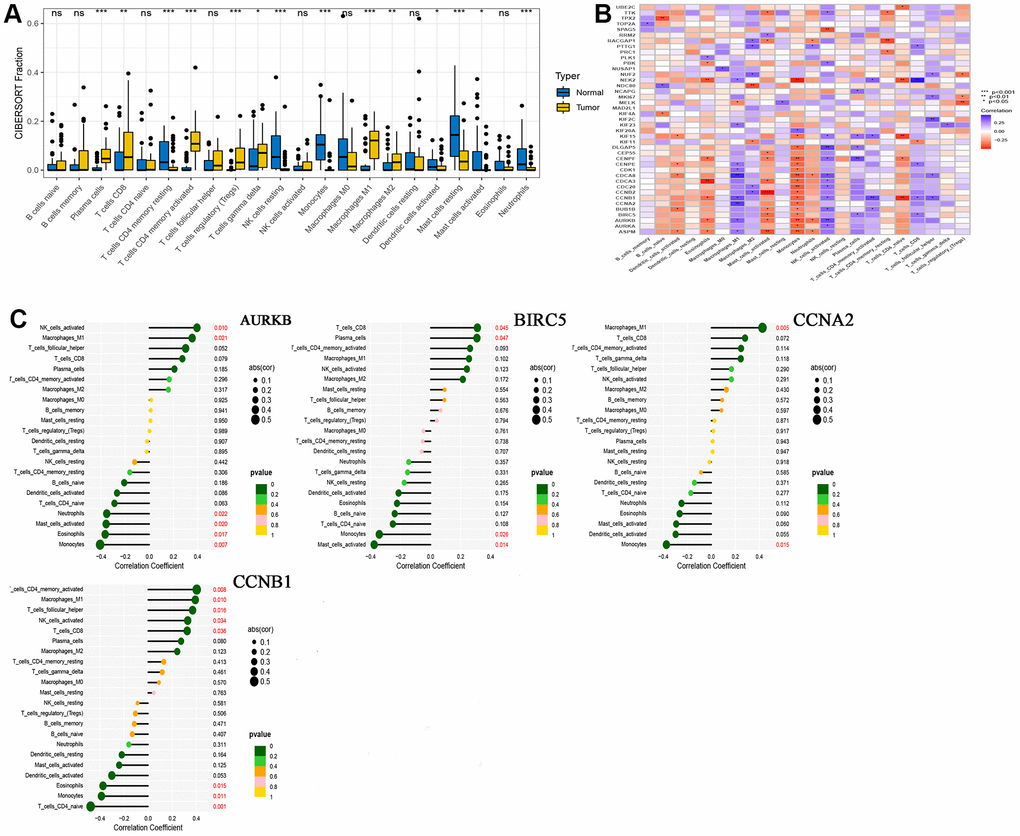
Figure 4.CIBERSORT analysis results. (A) Comparison of immune cell infiltration in normal and tumor tissues; (B) Correlation between 41 hub genes and immune cells; (C) A lollipop graph of the relationship between 4 drug-disease genes and different immune cells.