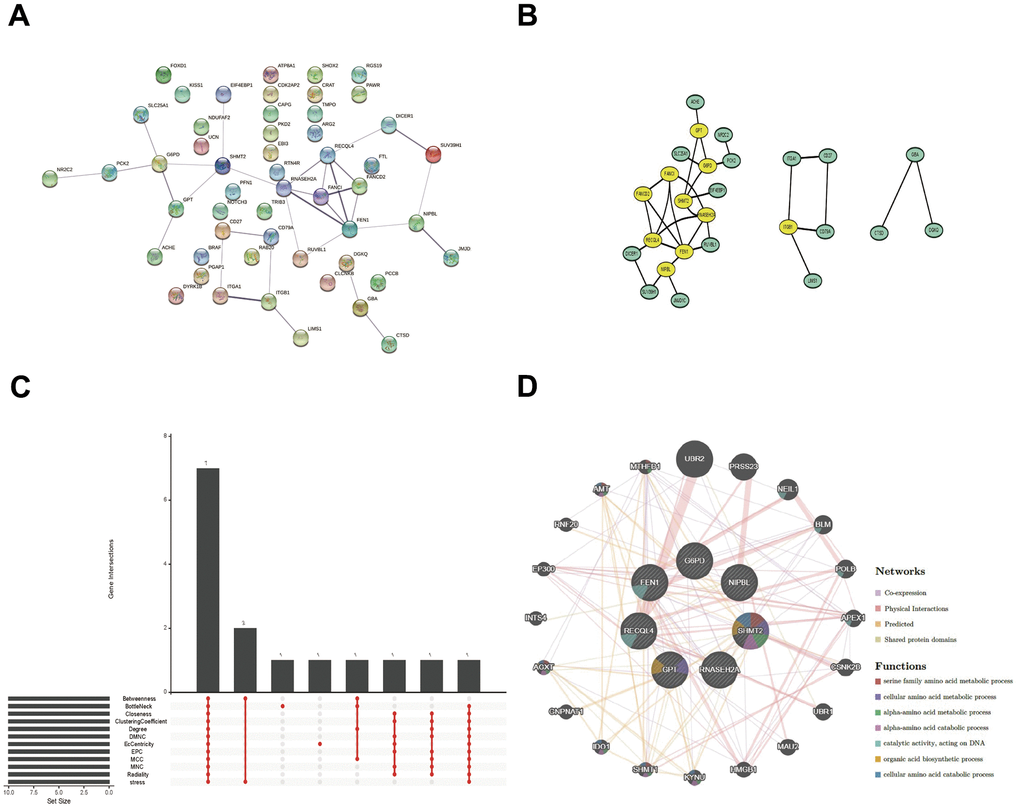
Figure 5.PPI network, Venn diagram, and co-expression network analysis. (A, B) The PPI network of the 52 overlapped genes through the STRING database. (C) The Venn diagram indicated that 7 hub genes were screened out by 12 algorithms. (D) Co-expression network of 7 hub genes was shown by GeneMANIA.