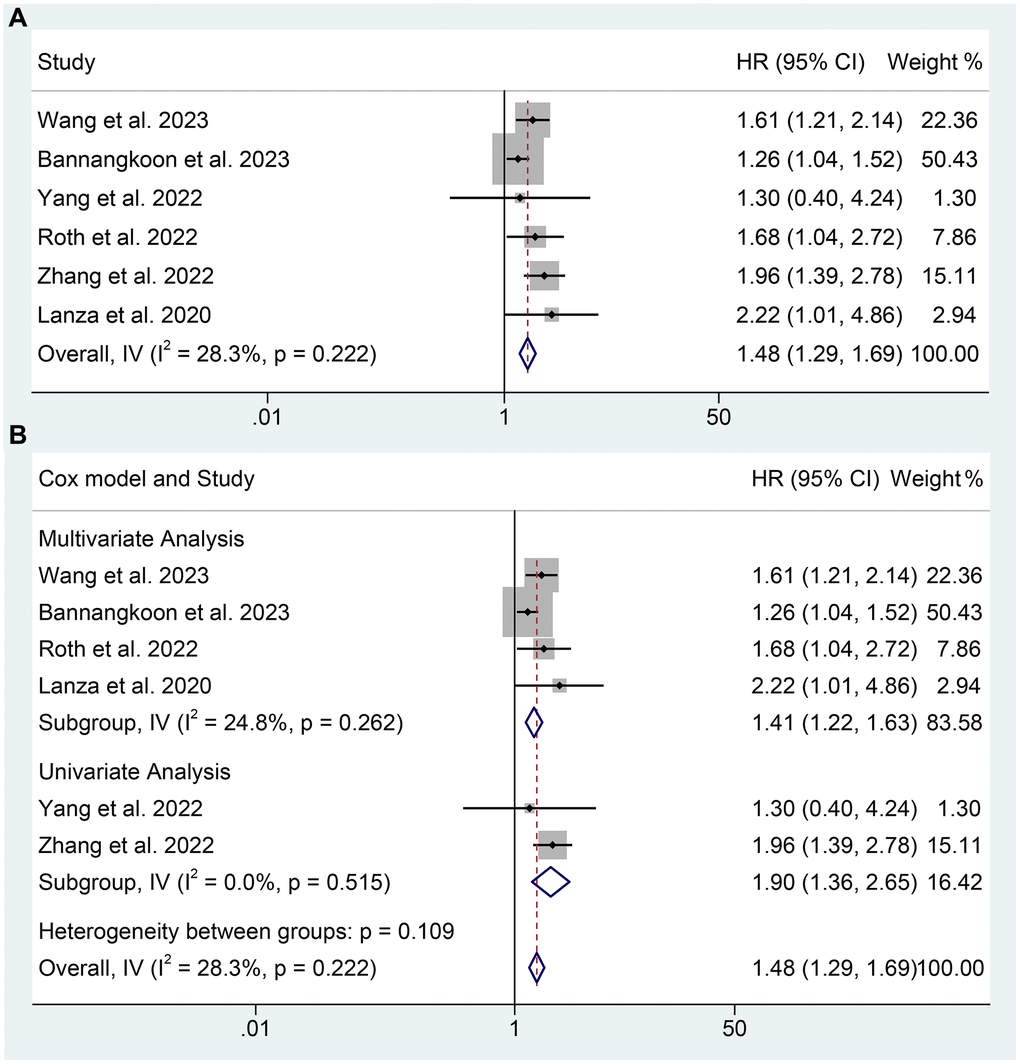
Figure 4.The relationship between SMI and OS in TAE or TACE treated HCC patients. (A) Taking the SMI as a binary variable; (B) Subgroup analysis of figure A.
Figure 4 — The predictive value of sarcopenia and myosteatosis in trans-arterial (chemo)-embolization treated HCC patients | Aging